

EVOLVE Operating Model Framework
Six stages from the enduring WHY to a model that keeps changing, three design layers from principles to specifications, and six dimensions that run through all of them.
An operating model designed in layers, and built to keep changing.
EVOLVE is a practitioner method for designing, building and evolving an operating model. Six stages carry the work from the enduring WHY to a model that adapts on its own. Three design layers take it from principles to specifications. Six dimensions keep every layer honest across organization, people and culture, process, digital, management and governance.
Most operating model work fails in a predictable place. The design is elegant and the execution is not, because nobody wrote down where the organization actually stood before the redesign started, and nobody attached a price to the beliefs the model was supposed to protect. This method treats both as evidence problems. The north star comes out of 65 interviews rather than a whiteboard. The baseline comes out of four lenses applied to what people do rather than what the process documentation claims.
Each stage ends at a gate with entry criteria, exit criteria and a named deliverable set. A gate is passed or held, not waved through. Fourteen worksheets are printed and filled in the room rather than circulated as templates, and every stage closes with reflection questions that test whether the intent will govern real decisions.
The method is not a waterfall. Establish and Validate run in parallel, the design layers iterate, and Evolve feeds both anchors continuously. Use the one-page diagram as a navigation aid: when a discussion stalls, name the box it belongs to before debating the answer.
Six stages, two anchors
Establish North Star sets the WHY and Validate Baseline records the NOW. The middle column is where design happens. Value Realization executes, and Evolve feeds back into both anchors.
Three design layers
Conceptual answers WHAT, logical answers HOW, detailed answers WHO, WHERE and WHEN. Detail is added only where a decision needs it.
Six dimensions, every layer
Organizational, people and culture, process, digital, management, governance. A dimension sitting two levels behind the rest caps the whole capability.
Gates that hold
Every stage ends with entry criteria, exit criteria and a deliverable list. Pass, conditional pass with a named owner and a date, or hold.
Adapted from Gustav Heymann, Engineered to Evolve and EVOLVE Your Operating Model. The field guide it is drawn from carries method pages, printable worksheets, stage gates and a reference section; this page publishes all of it except the worked client case.
Evolution debt is what you are actually paying down.
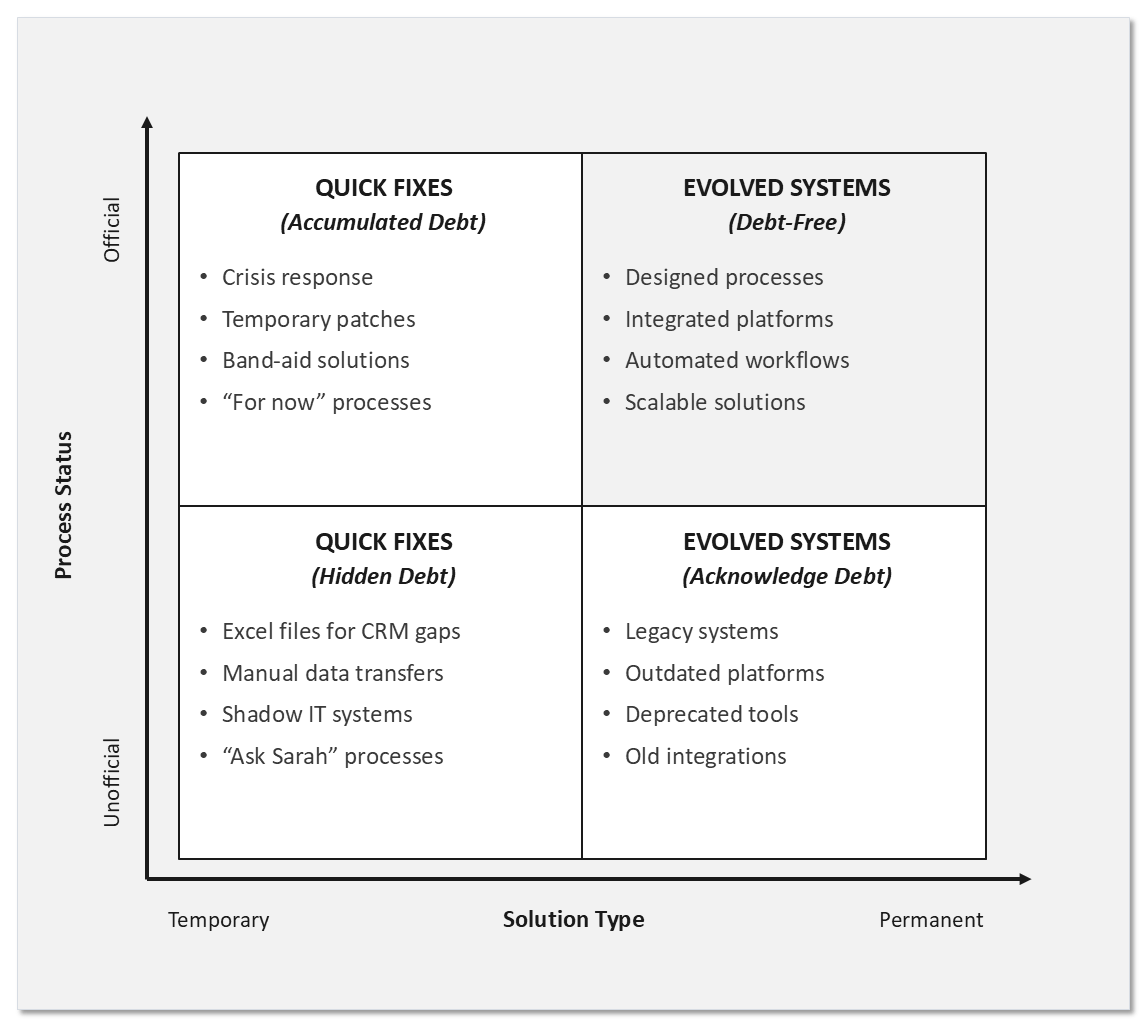
Debt accumulates every time a workaround is chosen over a real solution: the spreadsheet beside the CRM, the manual bridge between two systems that were meant to integrate, the shadow tool that works better than the official one.
It compounds. Every quarter of delay raises the eventual cost of change as workarounds harden into standard practice. The spreadsheet that covered a gap for one reporting cycle becomes the system of record nobody will admit to, and the integration it replaced is now harder to build than it was two years ago.
Plot the organization on two axes. Solution type runs from temporary to permanent. Process status runs from unofficial to official. The four quadrants separate debt you are carrying knowingly from debt nobody has named yet, and the unofficial quadrants are where the expensive surprises live.
EVOLVE on one page.
The framework is two anchors and one build. Establish North Star sets the WHY and Validate Baseline records the NOW; the middle column is where design happens, layer by layer, from principles down to detailed design.
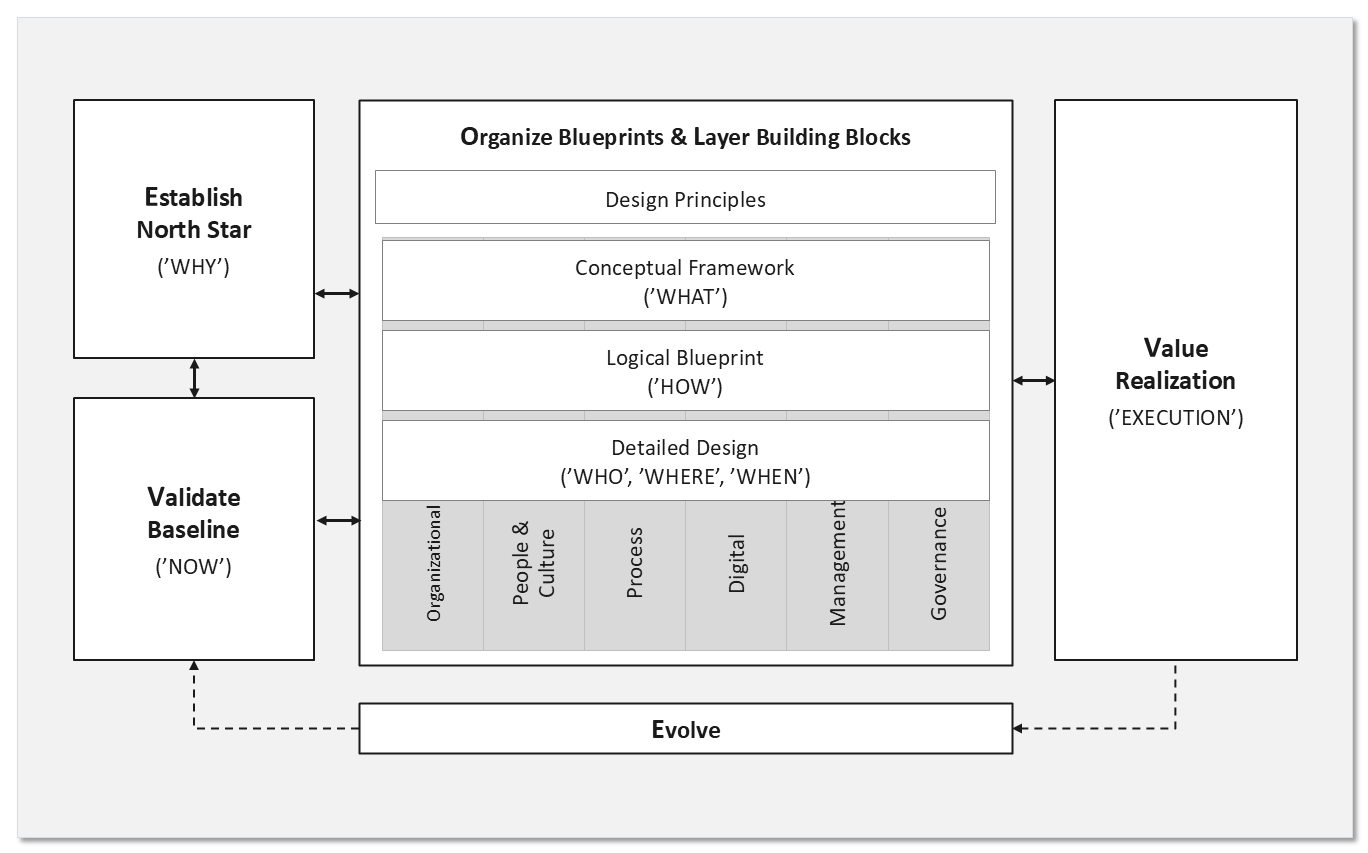
Stages are not a waterfall. Establish and Validate run in parallel, because a north star without honest assessment stays fantasy and an assessment without a north star only depresses people. The design layers iterate rather than complete in sequence. Evolve is not a closing phase; it runs from go-live onward and feeds both anchors continuously.
Ten design principles, in four tiers.
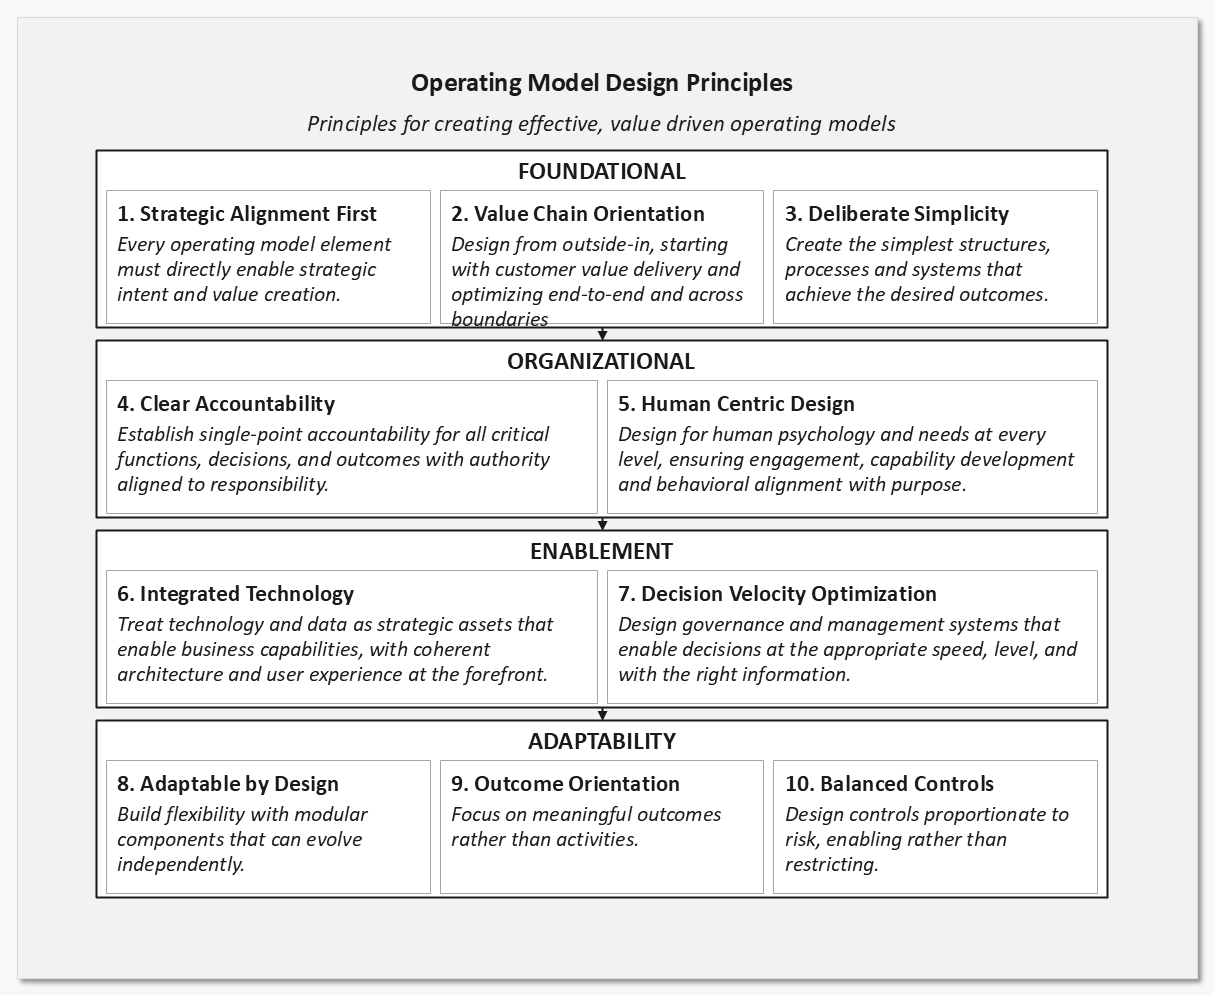
Ten principles govern operating model work: foundational choices about strategy and value, organizational choices about accountability and people, enablement through technology and decision speed, and adaptability so the model can keep changing.
Every design decision is tested against them. When two options both look defensible, work down the tiers in order, because a foundational principle outranks an enablement one. Record which principle decided the call, so the reasoning survives the meeting.
| Principle | What it requires |
|---|---|
| Foundational | |
| 1. Strategic alignment first | Every operating model element must directly enable strategic intent and value creation. |
| 2. Value chain orientation | Design from outside in, starting with customer value delivery and optimizing end to end and across boundaries. |
| 3. Deliberate simplicity | Create the simplest structures, processes and systems that achieve the desired outcomes. |
| Organizational | |
| 4. Clear accountability | Establish single-point accountability for all critical functions, decisions and outcomes, with authority aligned to responsibility. |
| 5. Human centric design | Design for human psychology and needs at every level, ensuring engagement, capability development and behavioural alignment with purpose. |
| Enablement | |
| 6. Integrated technology | Treat technology and data as strategic assets that enable business capabilities, with coherent architecture and user experience at the forefront. |
| 7. Decision velocity optimization | Design governance and management systems that enable decisions at the appropriate speed and level, and with the right information. |
| Adaptability | |
| 8. Adaptable by design | Build flexibility with modular components that can evolve independently. |
| 9. Outcome orientation | Focus on meaningful outcomes rather than activities. |
| 10. Balanced controls | Design controls proportionate to risk, enabling rather than restricting. |
Fix what will not change, so everything else can change faster.
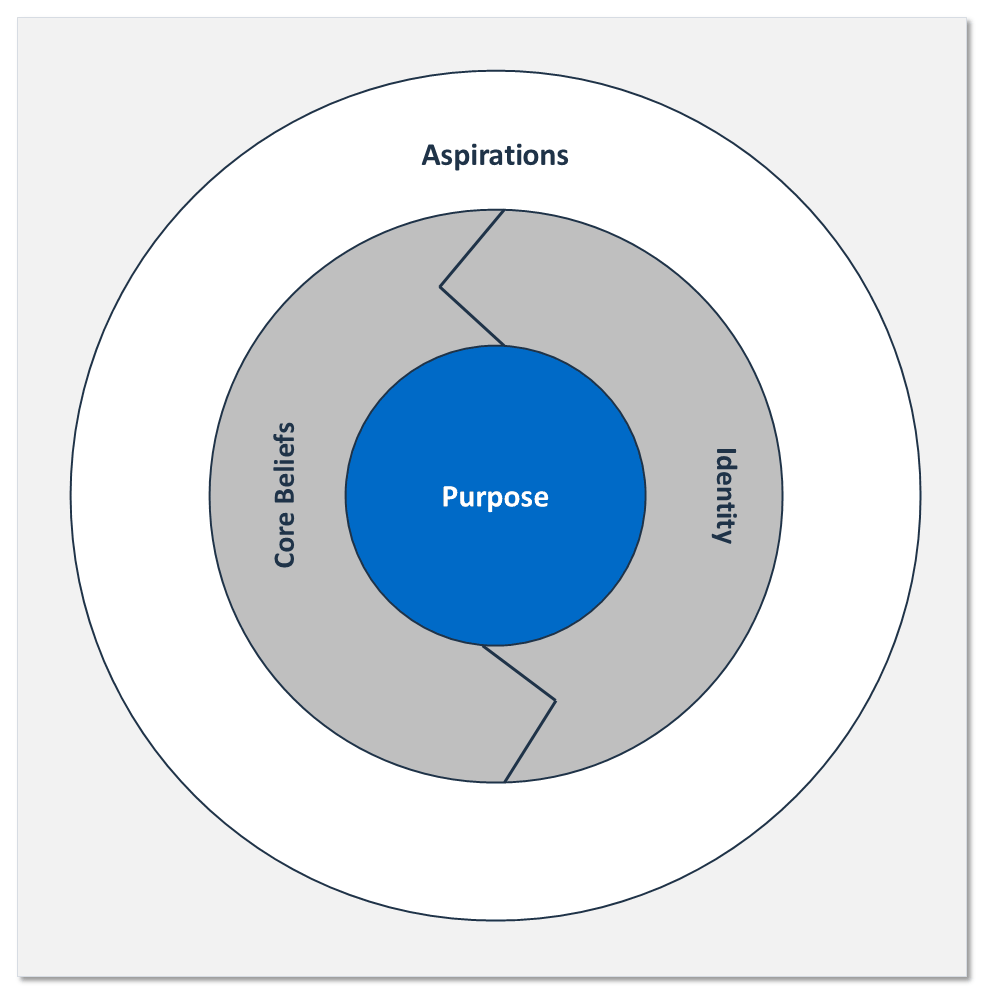
Stage 1 produces the enduring WHY: purpose, aspiration, core beliefs and identity. Four weeks elapsed, two days of protected leadership time, and it runs in parallel with Validate Baseline rather than before it.
Purpose
Fix what will not change, so everything else can change faster.
Inputs
30 employee interviews, 20 customer interviews including detractors, 10 former employees, 5 board members.
Activities
Evidence synthesis, then five canvases worked in sequence over a two-day offsite.
Outputs
Signed north star statement, three to five priced beliefs, embedding owners for five systems.
The four elements
Purpose is why you exist beyond profit, tested by what would be irreplaceable if you disappeared. Aspiration is where you are going, with numbers and dates a competitor could not reuse. Core beliefs are how you behave when it costs money, because principles without price tags are preferences. Identity is who you actually are, including an explicit statement of what you are not.
Evidence before workshop
The sequence is deliberate. Interviews happen before anyone enters the room, and the offsite synthesises evidence rather than generating opinion.
Interview four populations
Employees at all levels, customers including detractors, former employees, board members. Consistent protocol, stories not opinions.
Day one, morning: mine purpose
List everything that would cease to exist if the company disappeared. Remove anything a competitor could replace. What remains is purpose.
Day one, afternoon: the newspaper test
Write the headline you want in five years, with numbers and dates. If a competitor could run it with minor edits, start again.
Day two, morning: revealed preference
Document trade-offs from the past year where principle beat profit, and cost them. Fewer than three quantified examples means you have preferences.
Day two, afternoon: triangulate identity
Compare culture surveys with customer perception. Map capabilities competitors cannot replicate. Define explicitly what you are not.
Before you leave: assign embedding
Named owners for strategic planning, budget allocation, performance management, leadership development, communication rhythm.
Five canvases, worked in sequence.
Print them and fill them in the room. Each canvas has a place in the two-day sequence, and each one closes a question the next canvas depends on.
Worksheet 1 of 5Purpose discovery canvasDay one, morning
Six prompts that reconstruct purpose from evidence rather than restating it: why the organization was founded, what would be lost without it, why people invest their talent here, what it uniquely contributes, its peak moments, and the legacy it intends to leave.
Origin story
Why was the organization founded?
Meaningful impact
What would be lost if the organization ceases to exist tomorrow?
Personal connection
Why do our people invest their talents into the organization?
Distinctive contribution
What unique capabilities, perspectives or approaches does the organization have?
Legacy aspiration
What were our peak moments?
Ultimate legacy
What lasting difference do we aspire to make?
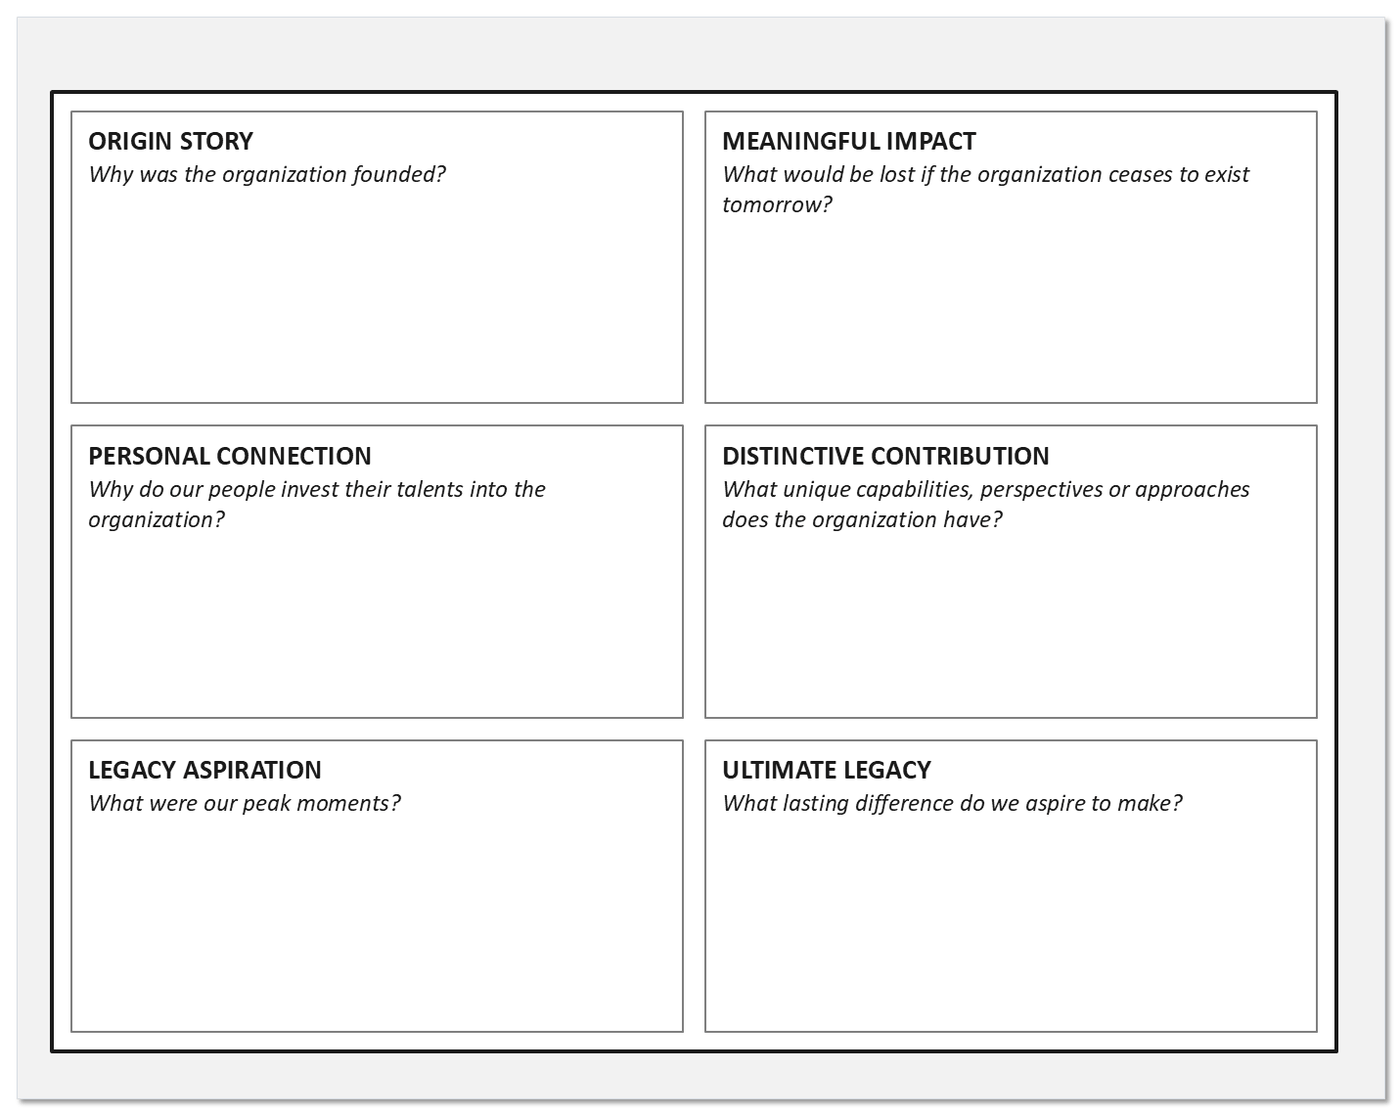
Complete it from interview evidence, not from the current mission statement. Use interviewees’ own words in each box. If a box can only be filled with corporate language, the evidence is not there yet.
Worksheet 2 of 5Aspiration articulation canvasDay one, afternoon
Four fields turn ambition into something testable: the time horizon, where you will play and at what scale, how capabilities must move from current to future state, and how you will recognize success when it arrives.
Time horizon
What is the appropriate timeline for the aspiration? Consider industry pace, investment needs, capability development needs and external context factors.
Market positioning
What distinctive place in the market will you occupy? Target customer segments, competitive differentiation, value proposition, brand perception goals.
Scale and scope
What will be your reach, size and impact? Geographic footprint, revenue and budget targets, customer reach, portfolio breadth.
Capability evolution
How will your capabilities transform? State three current capabilities and the three future states they must reach.
Success: financial
Revenue, profit, growth rates.
Success: market
Share, position, awareness.
Success: customer
Satisfaction, loyalty, adoption.
Success: qualitative
Brand perception, culture.
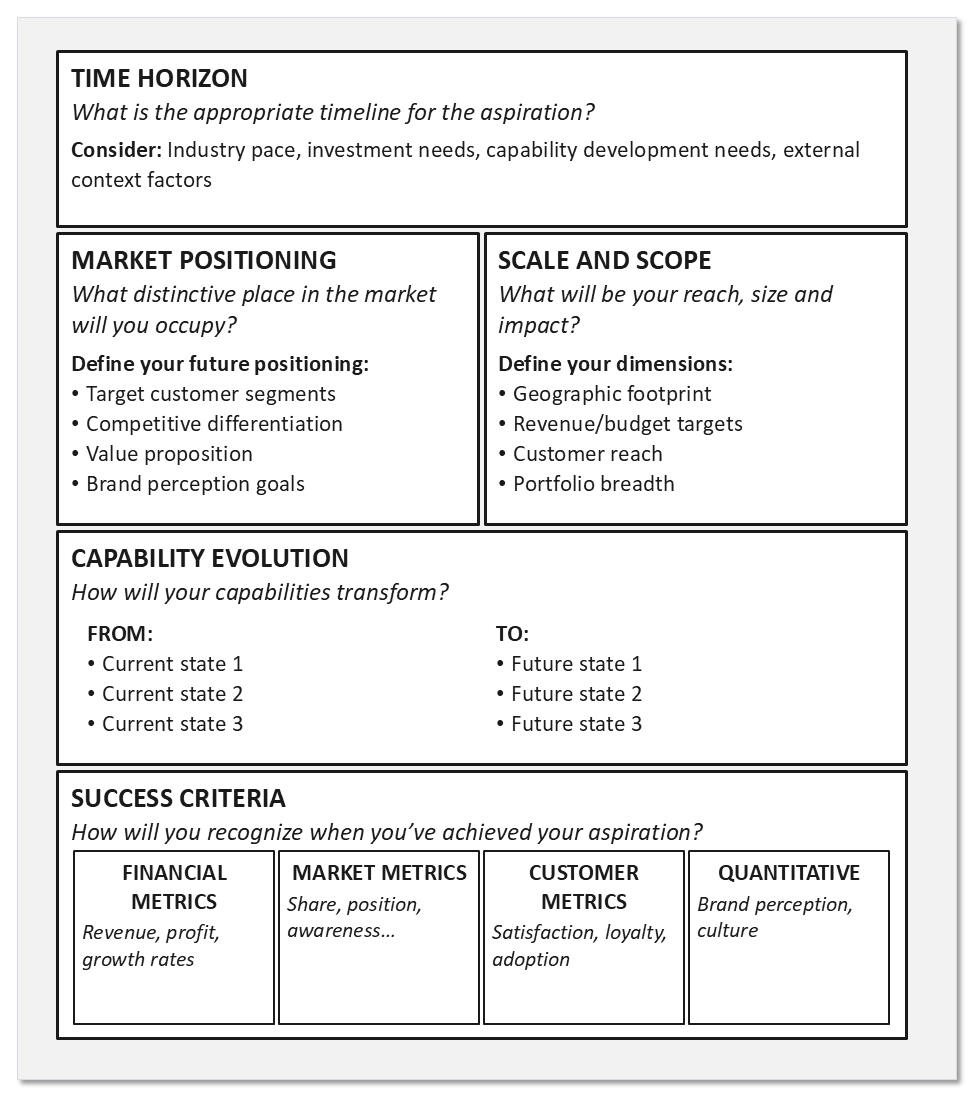
Numbers and dates in every field, and break the five-year outcome into annual milestones. Success criteria span financial, market, customer and qualitative measures so no single lens dominates the story.
Worksheet 3 of 5Core beliefs definition canvasDay two, morning
Five prompts pin down what the organization will and will not do: its ethical boundaries, the tensions it keeps having to resolve, how it allocates time and capital, how it treats new ideas, and how it partners.
Ethical boundaries
What moral and ethical standards guide your activities? Stakeholder treatment standards, environmental responsibilities, human rights and dignity. Define transparency expectations, social impact responsibilities and absolute no-go areas.
Decision tension
What recurring tensions or trade-offs do you face? Operational: standardization against customization, speed against quality, centralization against autonomy. Strategic: innovation against stability, short term against long term, growth against profitability.
Resource allocation
How do you determine where to invest time, attention and capital? Investment prioritization criteria, risk tolerance thresholds, time horizon preferences.
Innovation philosophy
How do you evaluate new ideas? Idea generation, evaluation criteria, risk tolerance, incremental against disruptive, failure response, innovation process preferences.
Partnership approach
What guides your approach to external relationships? Partnership selection criteria, collaboration principles, value exchange expectations, power dynamic preferences, shared risk and reward, exit guidelines.
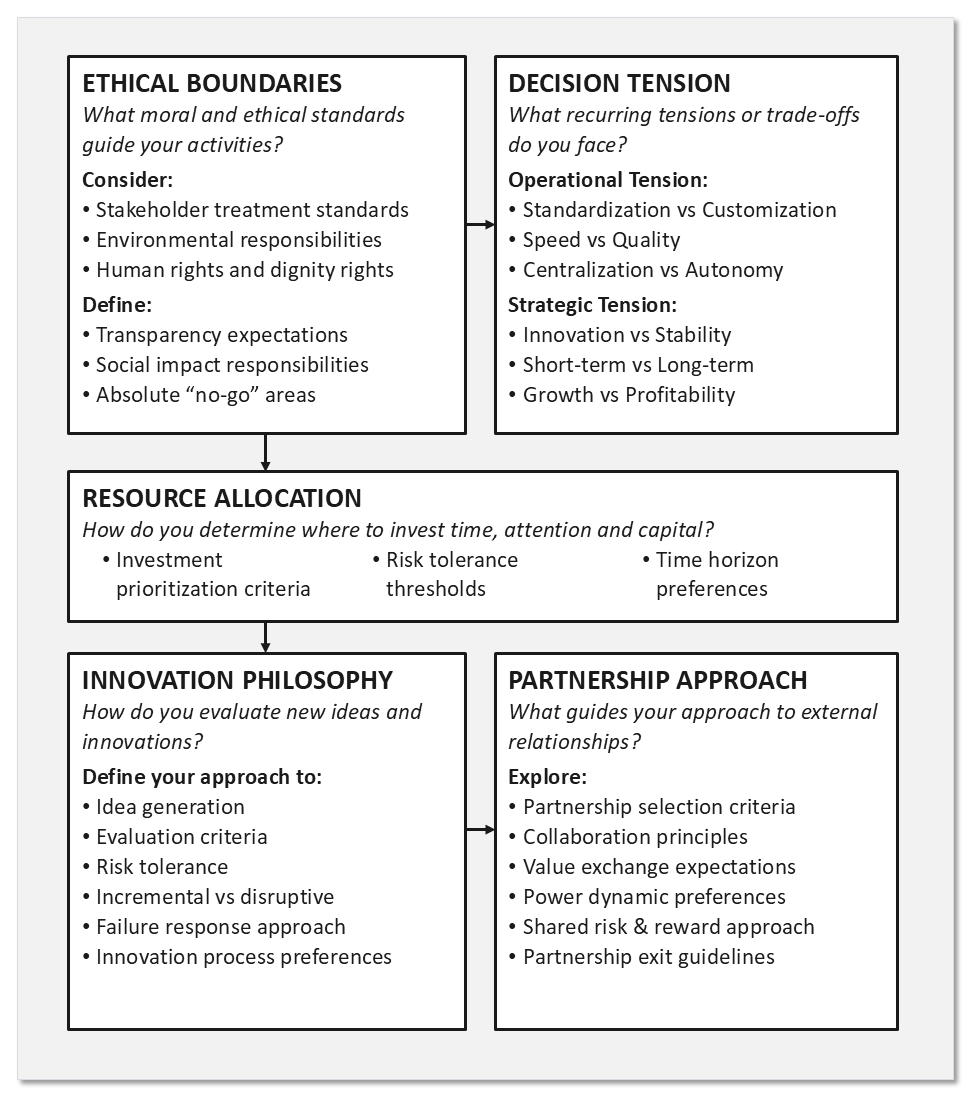
Three to five non-negotiables, each with an explicit cost attached. A belief that costs nothing to hold is a slogan, so name what you would give up to keep it.
Worksheet 4 of 5Identity exploration canvasDay two, afternoon
Four quadrants feed one answer. Cultural essence and heritage describe the organization from the inside; reputation desires and distinctive attributes describe it from the outside.
Cultural essence
What behavioural norms and shared mindsets are most essential? Core behavioural expectations, shared beliefs about work, decision making norms, collaboration patterns.
Reputation desires
How do you want to be perceived by different stakeholder groups? Customer, partner and supplier, industry and sector, community and public perception.
Heritage significance
Which aspects of your history and tradition remain relevant? Origin story elements worth preserving, historical values that still hold.
Distinctive attributes
What makes your organizational character genuinely different? Truly distinctive cultural traits, and identity elements competitors cannot easily duplicate.
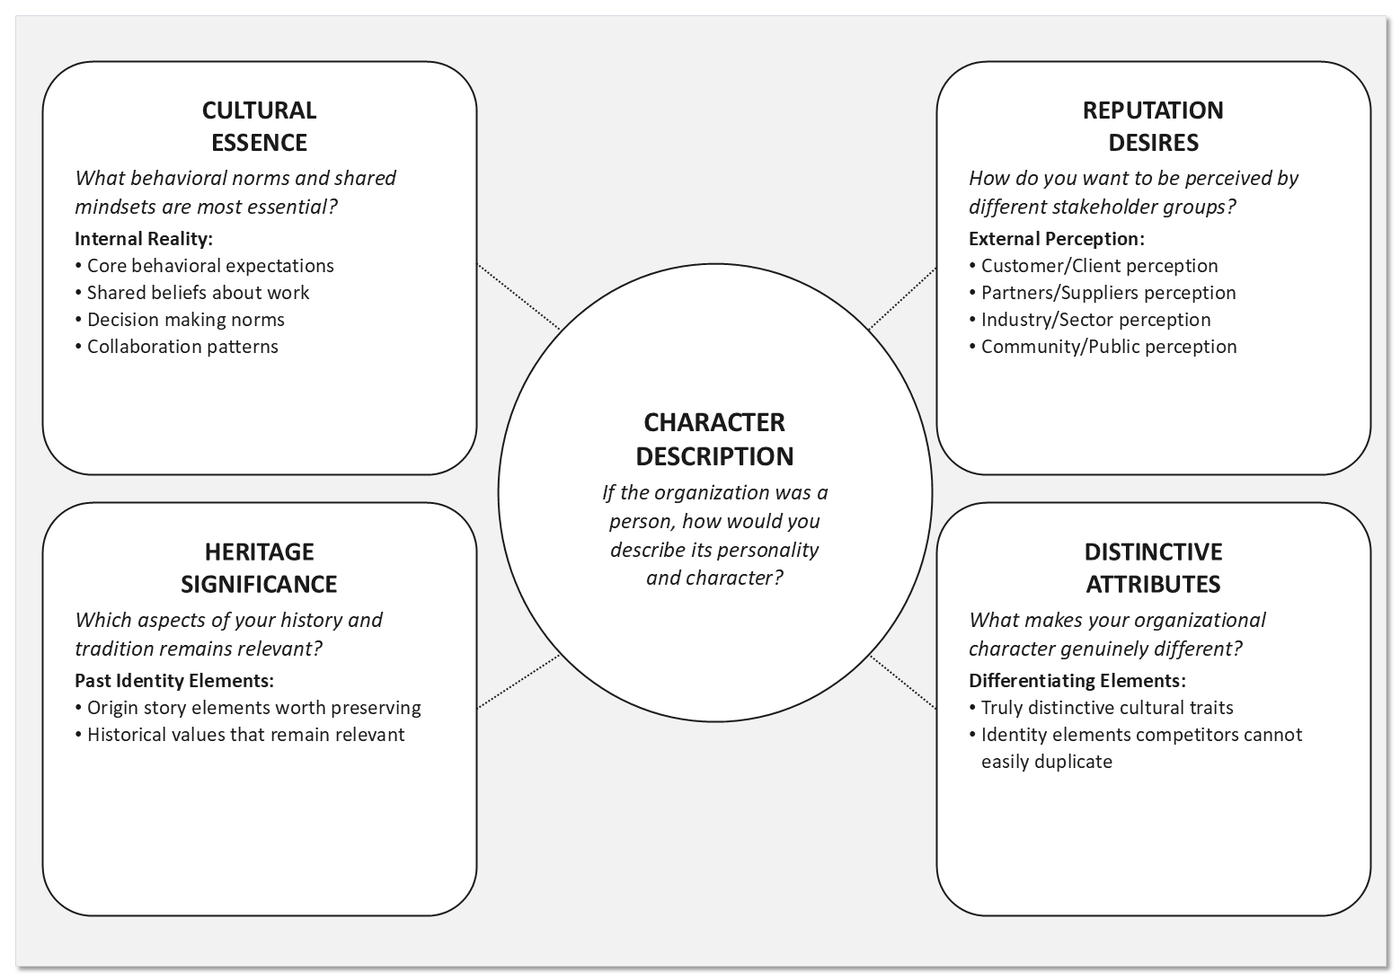
Triangulate internal culture data against customer perception, then state what you are not. Distinctiveness a competitor could copy by Friday does not belong in the centre circle.
Worksheet 5 of 5Strategic intent integration canvasClosing exercise
The closing canvas stacks the pieces. The WHY compass of purpose, aspiration, principles and identity sits above the value creation model, which rests in turn on enablers, measurable objectives and the regulatory envelope.
Purpose
Why do we exist?
Aspiration
What future do we seek?
Principles
What guides our decisions?
Identity
Who are we fundamentally?
Value creation model
How do we create, deliver and capture value?
Strategic enablers
What capabilities and resources do we need?
Strategic objectives
What measurable outcomes will we achieve?
Regulations
What regulations impact our operating environment?
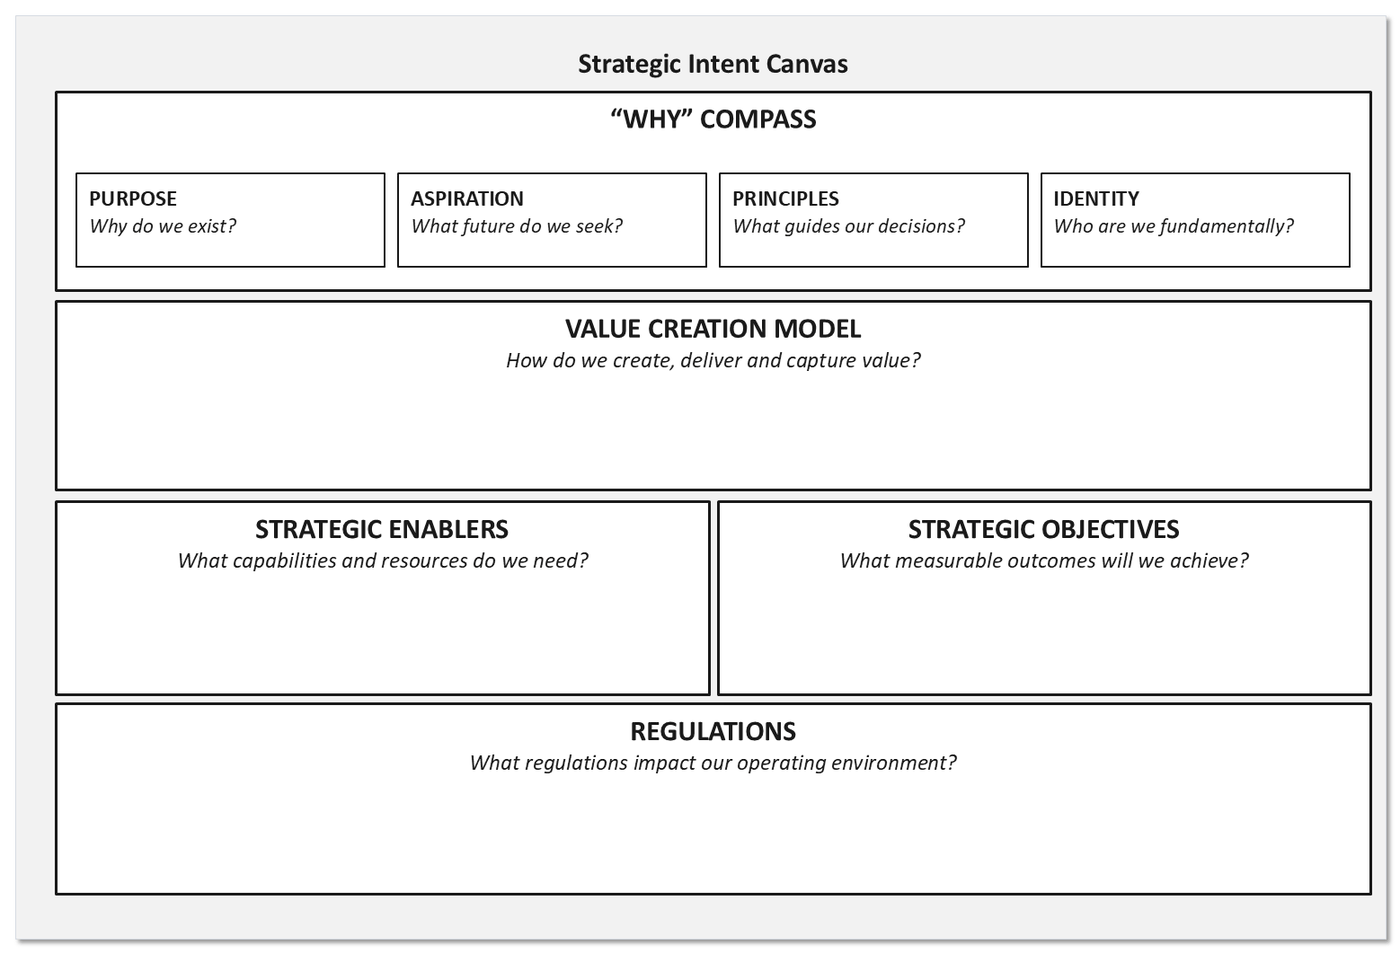
For each connection, name the mechanism of reinforcement and the tension it carries. If a box cannot be traced back up to the compass, it is not yet strategic intent.
North star ratified.
A gate is passed on evidence or held. Returning to this stage later costs more than holding it now.
Entry criteria
Sponsor named and accountable. Two consecutive days protected in the leadership calendar. 65 interviews completed and synthesized. Board perspective on purpose and constraints captured.
Exit criteria
One-sentence purpose a front-line employee can restate. Aspiration with numbers and dates, split into annual milestones. Three to five beliefs with quantified price tags. Identity statement including what you are not. Reinforcement mechanisms documented for every connection.
Deliverables
North star statement, signed. Five completed canvases. Embedding plan with owners for five systems. Three decisions in the next 30 days nominated as north star tests.
Pass
Every exit criterion evidenced. The next stage starts with its inputs complete.
Conditional pass
One criterion open, with a named owner and a date. Record it rather than re-opening it later.
Hold
Evidence missing rather than late. Returning here costs less than discovering it downstream.
Reflection questions
Answer these before the north star is treated as settled. They test whether the intent will actually govern decisions, or whether it will sit on a wall while the old logic keeps running. A hesitation here becomes evolution debt later.
- Does your purpose statement guide real operating decisions, or does it just sound nice?
- Is your aspiration concrete enough to guide choices but flexible enough to evolve?
- Which recurring tensions still lack a clear principle to guide their resolution?
- How well does your stated identity match what employees and customers actually experience?
- Can you trace your most recent major decisions directly back to your strategic intent?
Where you actually stand, in evidence.
Stage 2 establishes the NOW: capability, maturity, structure and governance. Six to eight weeks elapsed, running in parallel with Establish North Star, so the gap between the two can be measured rather than argued.
Purpose
Establish where the organization actually is, in evidence, so the gap to the north star can be measured.
Inputs
Industry reference model, existing documentation treated as unreliable, incident logs, performance data, observation time on the floor.
Activities
Four lenses in sequence: capability map, maturity assessment, coverage matrix, decision inventory. Then cross-validate.
Outputs
Capability heat map, maturity scores with evidence, coverage matrix, decision inventory, governance map, evolution debt register.
Not “do you have a process?” but “show me someone following it.” Not “is it documented?” but “when did anyone last read the documentation?”
The four lenses
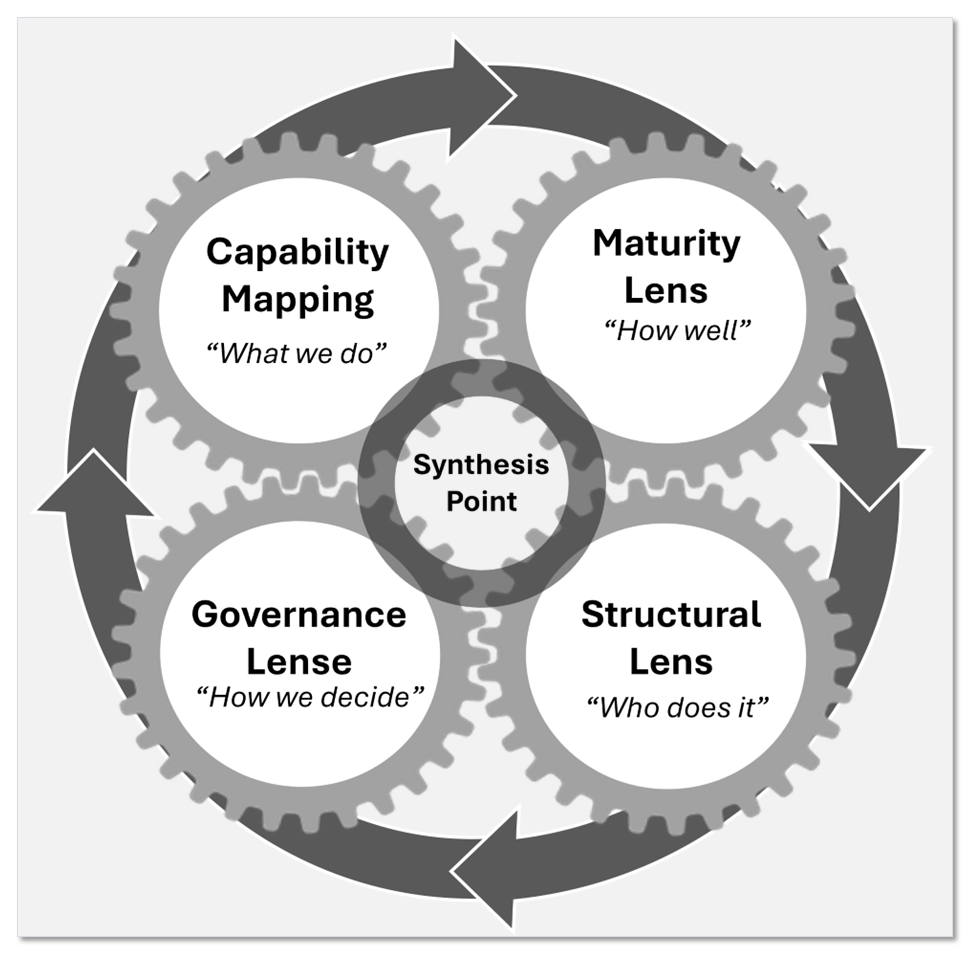
Capability asks what the organization actually does, independent of who does it. Maturity asks how well each capability performs, scored against evidence. Structure asks who owns what, and where ownership is missing or contested. Governance asks how decisions actually get made, timed on a real decision.
Cross-validation is where the diagnosis lands. High maturity with unclear ownership means heroes are holding it together. Low maturity with strong governance means process without competence.
Lens 1: mapping business capabilities
Three buckets
Strategic capabilities set direction. Core customer-facing capabilities make the money. Supporting capabilities keep the lights on.
Three levels, no more
Level 1: eight to twelve capabilities that describe the whole business. Level 2: three to five groups each. Level 3: operational detail, 100 to 200 in total.
Two-day workshop
Day 1 defines levels 1 and 2. Day 2 details level 3 where it matters and validates that every major activity has a home.
Three common mistakes. More than twelve level 1 capabilities means you are confusing capabilities with activities. Departments listed as capabilities means the org chart has been copied across; it is not the capability map. Verbs instead of nouns: “manage customers” is a process, “customer management” is a capability.
Lens 2: the five levels of maturity
Most organizations believe they are at level 4. Most are at level 2. Level 3 is the right target for most capabilities, and level 5 should be reserved for the ones that differentiate.
| Level | Name | What it looks like |
|---|---|---|
| 1 | Initial | It happens sometimes, somehow. Everything depends on individuals and their private knowledge. |
| 2 | Managed | Basic processes exist and are sometimes followed. Problems get fixed after they explode. |
| 3 | Defined | Standardized, documented, actually followed. Systems support the process rather than fight it. |
| 4 | Quantified | Measured in real time, with analysis that predicts problems before they occur. |
| 5 | Optimizing | The capability improves itself. Reserved for what differentiates the business. |
Score the dimensions, then find the orphans.
One worksheet carries the maturity assessment across all six dimensions. Two further lenses expose who owns what and how decisions really move, and a register puts a number on the debt.
WorksheetSix-dimension maturity matrixOne sheet per critical capability
Six dimensions, five levels, one ladder. Organizational, people and culture, process, digital, management and governance are each scored from foundational through to leading.
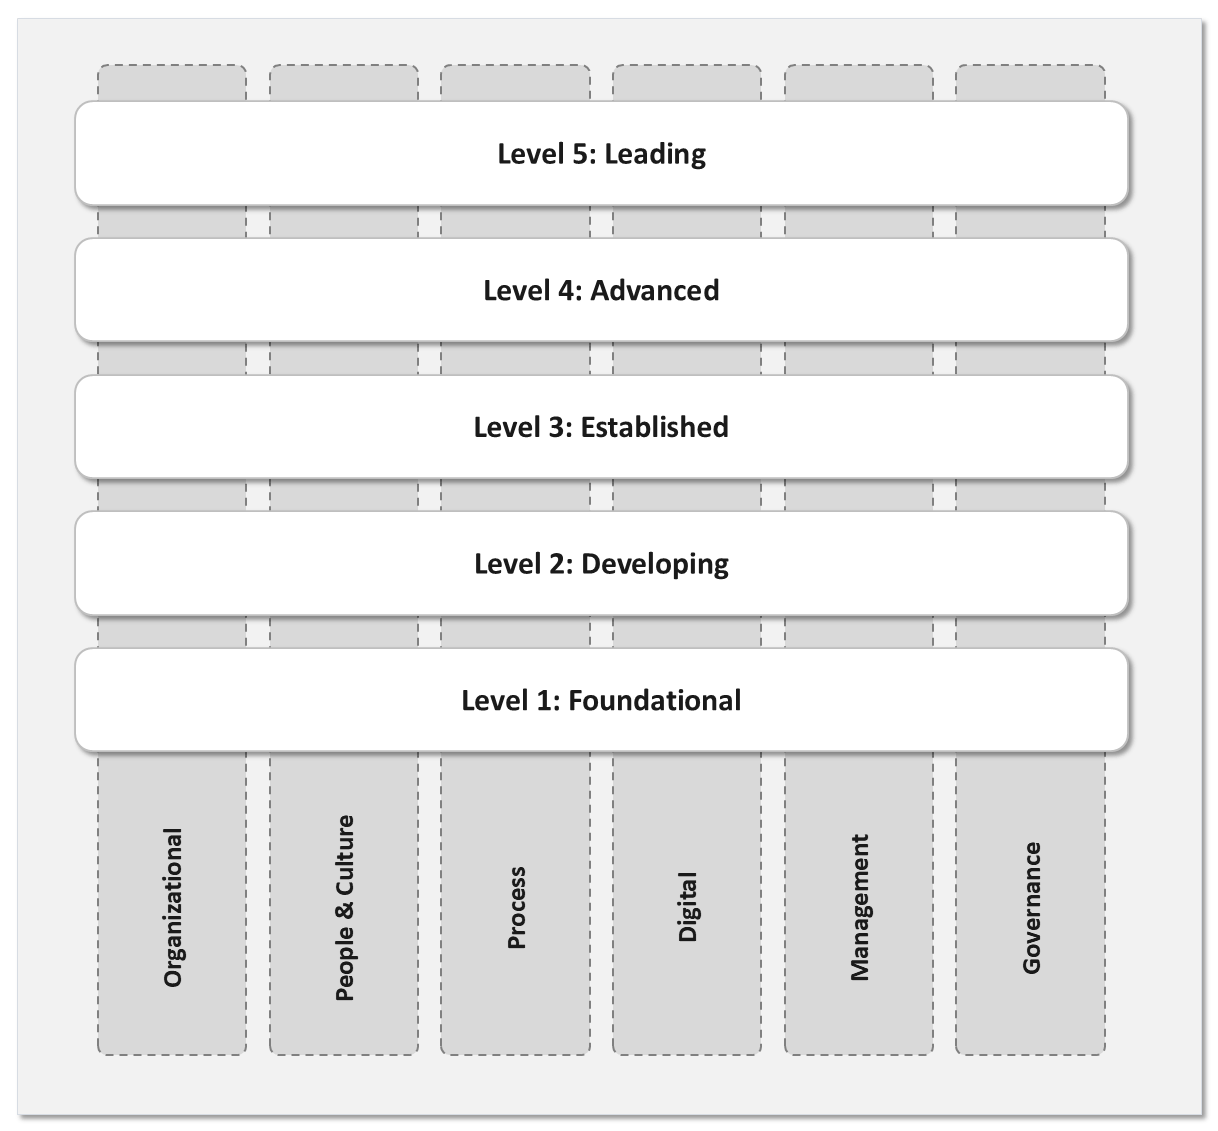
Score each dimension 1 to 5 against evidence, then read the imbalance: a dimension sitting two levels behind the rest is usually what caps the whole capability.
Lenses 3 and 4: structure and governance
The coverage matrix
Capabilities down the left, departments across the top. Mark P for primary owner, S for supporting, C for contributing. No P is an orphan, happening with nobody accountable. Multiple Ps is a war zone. A department with too many Ps is overwhelmed and under-delivering on all of them.
The decision inventory
The fifty decisions that matter most: who decides, how long it takes, how many people touch it, where it stalls. Extend RACI with V for verifies and S for signs off. Track one real decision end to end and time it.
The governance map
Every committee, its charter, and the real decisions it owns. Not reviews, not oversees. Owns. Count decisions actually made last quarter and divide by the number of bodies. If a committee does not own three real decisions, it is a candidate for closure.
Map stakeholder pain to structural cause: board members see risk they cannot trace to an owner, executives see strategies that will not execute, managers see daily friction, employees see work undone by other groups. These artifacts do not argue for change, they make the need impossible to ignore.
Scoring evolution debt
Register
Every named workaround: the spreadsheet outside the system, the manual bridge, the shadow tool, the undocumented exception. Owner, frequency, people affected.
Cost
Annual carrying cost per item: effort hours, error rework, delay, risk exposure, and the capability it blocks. Plot on the evolution debt matrix by cost and by risk.
Compounding
Delay raises the eventual cost of change. Debt left to accumulate can cost more to repay than the system would cost to rebuild.
Reference channels for leakage: manual process exceptions erode automation benefit, unmanaged scope adds operational cost, and shadow systems consume IT budget that was never allocated to them.
Baseline accepted.
The gate that matters most, because every later design decision rests on the honesty of this one.
Entry criteria
Amnesty declared in writing by the sponsor. Assessment team includes people who know how work really happens. Industry reference model selected. Observation access granted on the floor.
Exit criteria
Every major activity has a home in the capability map. Maturity scores carry evidence, not opinion, and have been calibrated across teams. Orphan and contested capabilities are named. Decision cycle times measured on real decisions. Evolution debt quantified.
Deliverables
Capability map with heat map. Maturity matrices for critical capabilities. Coverage matrix. Decision inventory. Governance map. Evolution debt register. One-page gap statement against the north star.
Reflection questions
Answer these before the baseline is accepted. Every one of them is a place where organizations substitute a comfortable belief for evidence, and then design on top of it. Numbers create urgency that adjectives never will, and shared discovery is what creates alignment.
- Which of the four lenses have you not actually run, and what would it change if you did?
- Where are you claiming level 4 maturity on evidence that only supports level 2?
- What is your evolution debt costing per day, and who in the room has seen that number?
- Which core capability has no single owner, and which one has three?
- What did the baseline tell you that leadership has not yet accepted out loud?
Settle the tensions leaders keep re-arguing.
Stage 3 forges the design principles and chooses one philosophy per dimension. Four to six weeks elapsed, two days of leadership workshops. A principle nobody would fight is not a principle.
Purpose
Settle the tensions leaders keep re-arguing, then choose one philosophy per dimension.
Inputs
Signed north star statement, the baseline evidence from stage V, and every tension the assessment exposed.
Activities
Five-step forging process for principles, tension mapping, then six conceptual workshops, one per dimension.
Outputs
Design principles with per-function implications, tension mapping canvas, stress-test record, six architecture choices with rationale.
Anatomy of a working principle
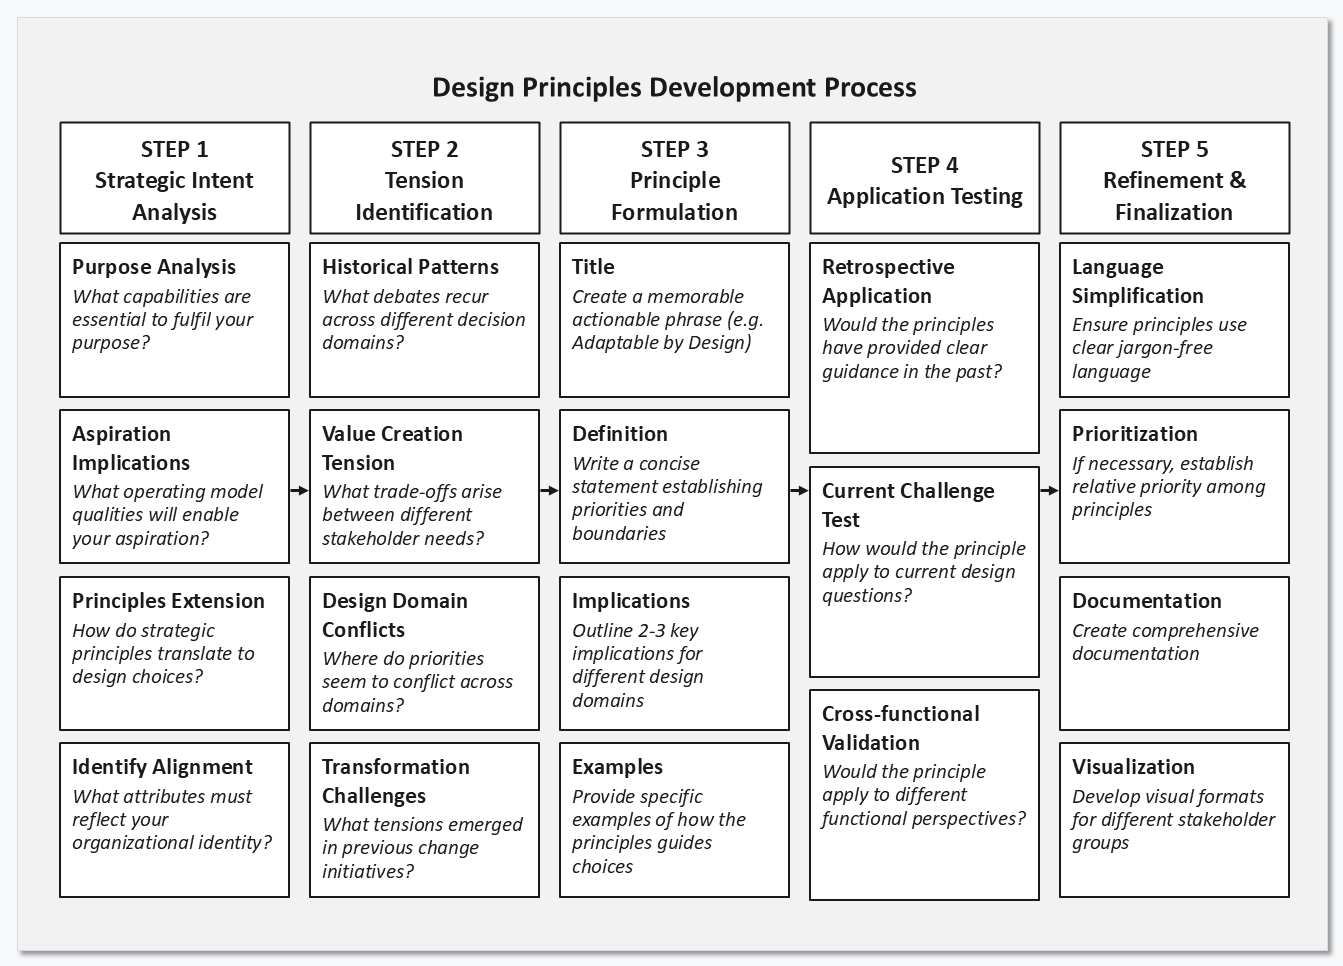
A principle is machinery, not poetry. It turns a recurring tension into a settled decision that a junior employee can make without asking.
A handle
A phrase people can grab and repeat in a meeting. “Radical transparency.” “Primitives not solutions.” “Automate the predictable, humanize the exceptional.”
Precision
It states what is permitted and what is not, clearly enough to be uncomfortable. Not inspiring, just clear.
Implications for work
What it means concretely for each function, so engineers, sellers and designers draw the same conclusion from it.
The five-step forging process
Mine strategic intent
Take the purpose statement and make it hurt. Document every constraint and requirement it implies.
Map critical tensions
The universal ones plus the organization’s own. Count the meetings spent relitigating each.
Formulate drafts
One principle per tension, written to resolve it rather than balance it.
Stress-test
Run the last ten controversial decisions and one currently stuck decision through them. Check for collisions between principles.
Embed and evolve
Wire them into performance reviews, meeting formats and compensation. Then maintain them.
WorksheetTension mapping canvasFrequency against impact
Plot each tension by how often it recurs and how much it matters. Frequent and high impact needs a core belief. Rare but high impact needs clear decision rights and an escalation path. Frequent and low impact needs rules and standard operating procedures.
High impact, low frequency
Strategic inflection. Clear decision rights and an escalation path.
High impact, high frequency
Define core beliefs. This is true north territory.
Low impact, low frequency
Discretion. Do not require a formal principle.
Low impact, high frequency
Streamline. Clear rules and standard operating procedures.
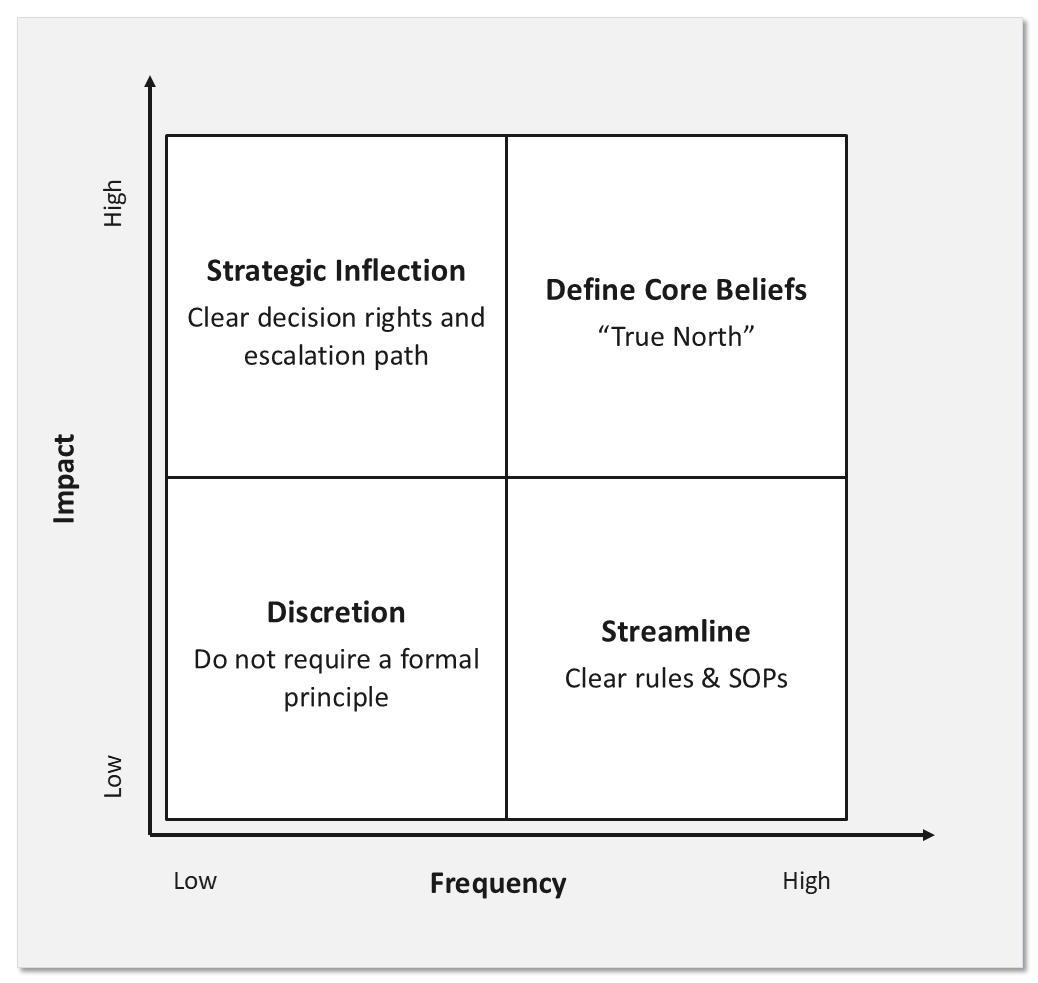
Start with efficiency against effectiveness, speed against quality, growth against risk, and global consistency against local adaptation. Then add the organization’s own. Anything low on both axes can be left to discretion.
Three layers, six dimensions.
The design work is organized as a grid. Three layers move from philosophy to specification; six dimensions run through all three so a choice in one place cannot quietly contradict a choice in another.
Conceptual
The organizing philosophy for each dimension. City planning before building design.
Logical blueprint
How capabilities connect, information flows, and decisions are made. Blueprints before construction detail.
Detailed design
Which teams own what, where work happens, when processes trigger. Construction specifications.
Enterprise
Structure and boundaries.
Workforce
Capability and culture.
Value
Creation and delivery.
Digital
Technology, data, AI.
Management
Execution and coordination.
Governance
Oversight and control.
The conceptual layer: six questions
The conceptual layer asks one philosophy question per dimension: how the enterprise is structured, how people are led, how value is created, how digital is approached, how execution is managed, and how oversight works.
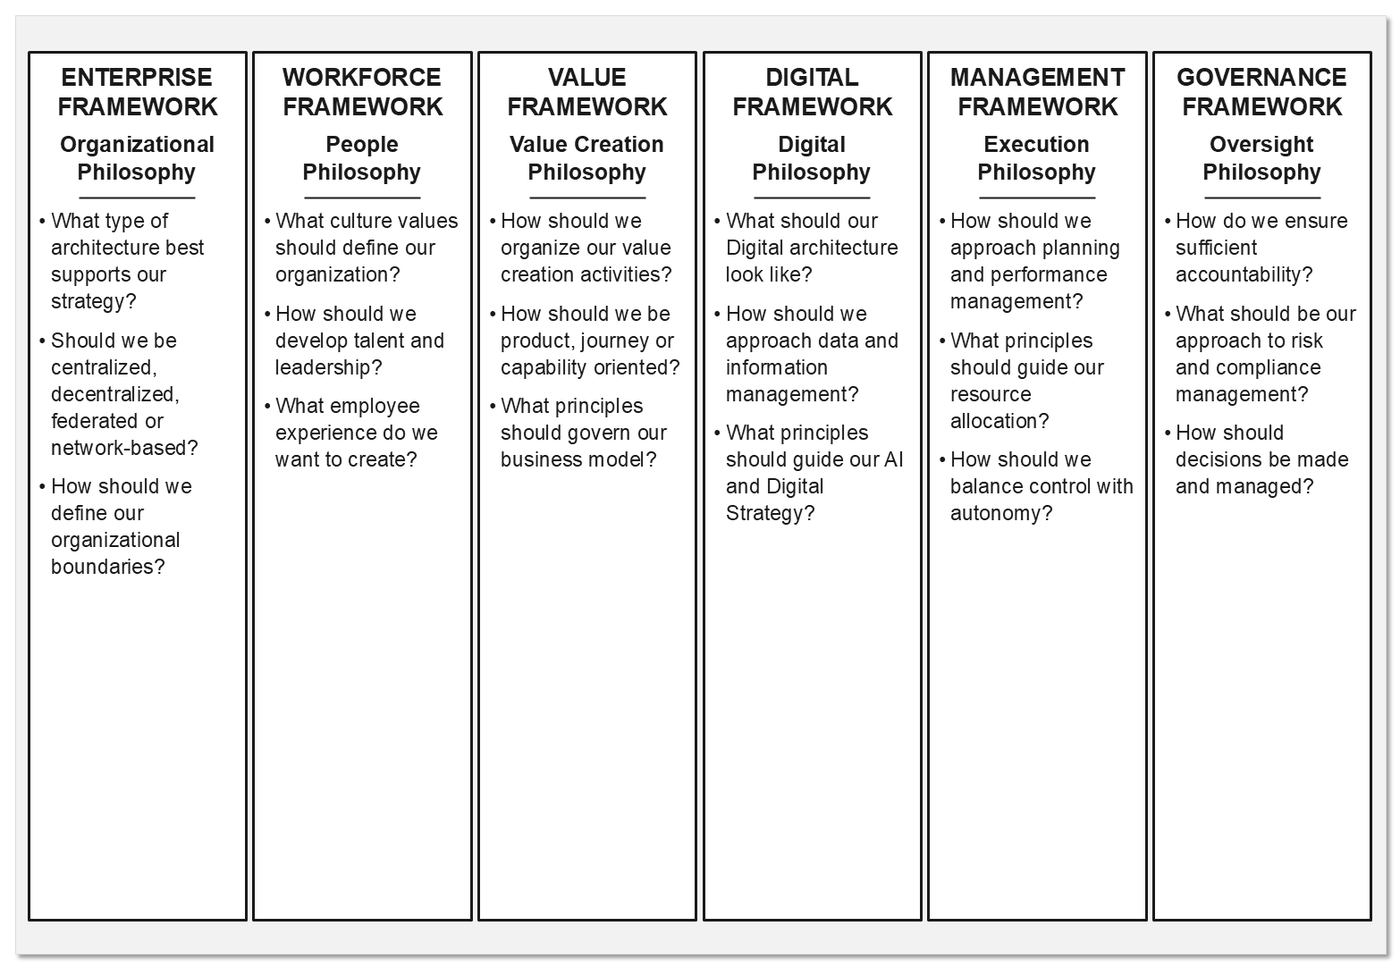
Record the trade-off you accepted. Later layers inherit it whether or not it was deliberate.
Six ways to run the conceptual workshop
Leadership teams need structure when making philosophy-level choices, or the workshop becomes a debate about preferences. These six devices give the session that structure: the first three discipline the decision, the last three supply the raw material.
Strategic intent traceability
Every conceptual choice must link back to purpose and aspiration. If a decision cannot be traced to strategic intent, kill it. No exceptions.
Design principle application
Use the ten principles as filters. Each choice passes through them and what does not fit is rejected, not negotiated down.
Tension resolution
Design is trade-offs: speed against control, flexibility against efficiency, local responsiveness against global consistency. Choose openly instead of pretending the tension is absent.
Future-back design
Start from where you need to be in five years and work backwards. This exposes gaps that planning forward from today never surfaces.
Industry pattern analysis
Study what succeeds inside and outside your sector, then adapt rather than copy. A retailer’s hub and spoke becomes a bank’s regional expertise centres.
Anti-pattern identification
Some approaches fail predictably: centralization that ignores local markets, decision rights without accountability. Name them before you design, not after.
Run 01 to 03 as standing rules for the whole session. Reach for 04 to 06 when the room stalls or keeps proposing the current model back to itself.
One archetype per dimension, chosen with its costs.
Each dimension has a small set of coherent philosophies. Choosing one means accepting what it gives up, which is why fantasy combinations get named and rejected here rather than discovered in stage 5.
Dimension 1Enterprise: operating model archetypesIntegration against standardization
Resolve three questions: what architecture supports the strategy, how centralized the organization should be, and where its boundaries sit.
Coordination
Integrated customer and product data, unique business unit processes, shared access to enterprise information. Seen in financial services firms.
Unification
Highly integrated operations, standardized end-to-end processes, enterprise-wide data and systems. Seen in airlines and integrated manufacturers.
Diversification
Autonomous business units, limited shared services, independent systems and data. Seen in traditional holding companies.
Replication
Standardized business processes, limited data sharing between units, template-based systems. Seen in retail chains and franchise operations.
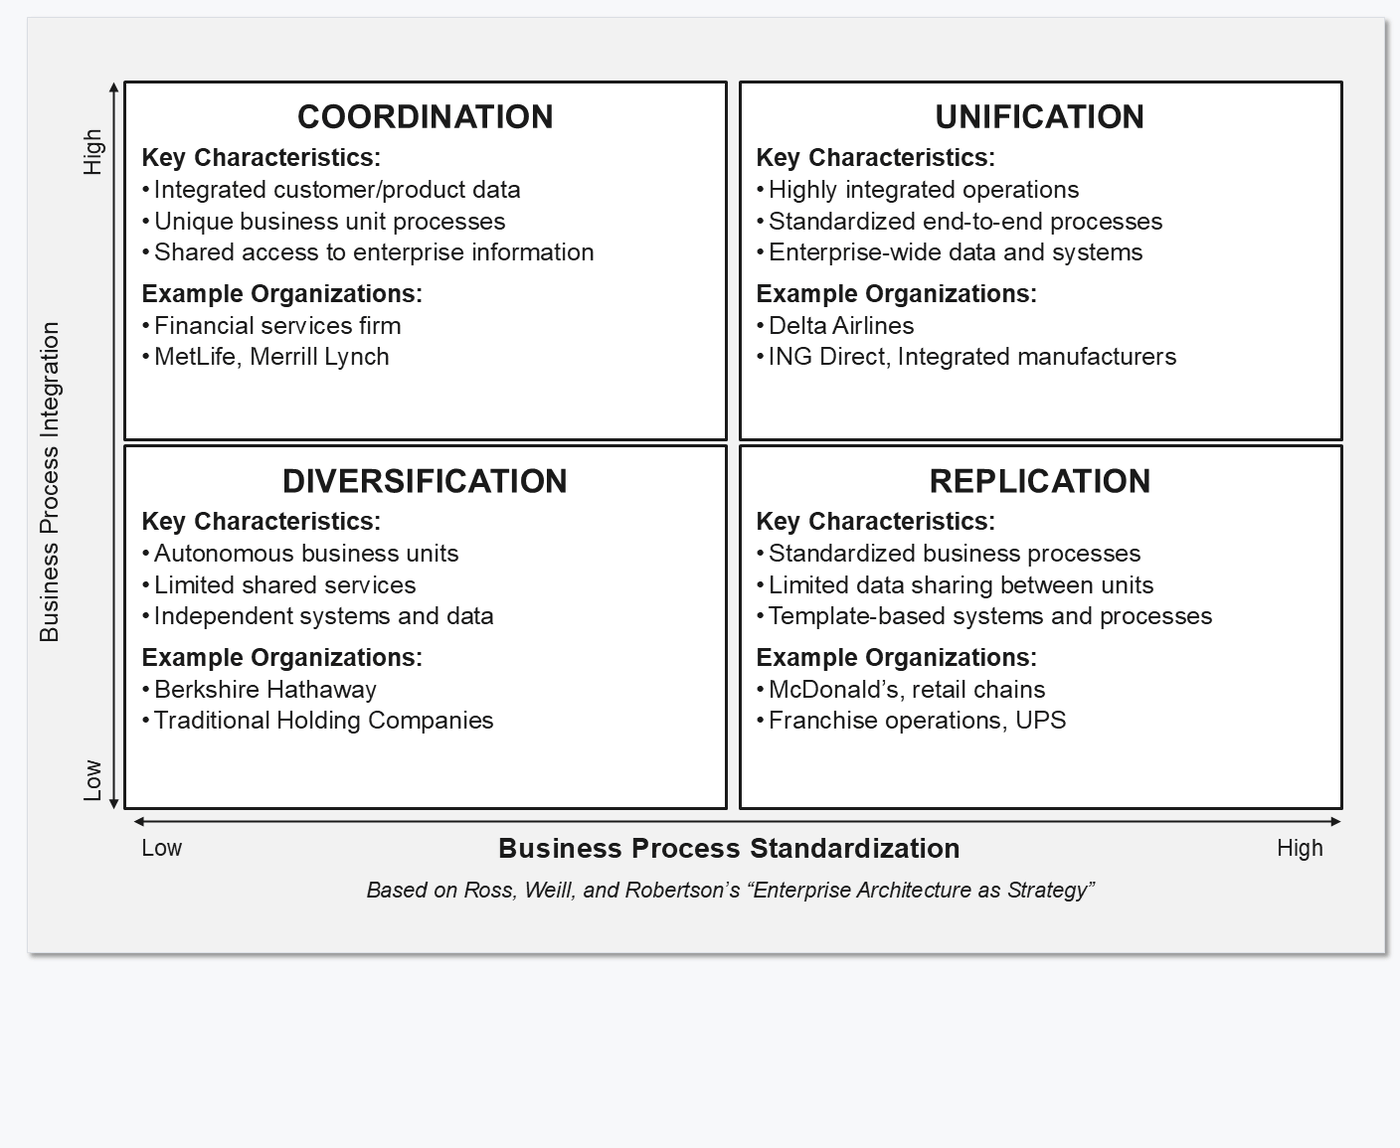
Watch for fantasy architectures: “decentralized like Spotify but coordinated like Apple.” Each archetype carries costs the others do not.
Worksheet 1 of 2Organizational philosophy analysis toolSix sliders
Six sliders describe organizational philosophy: centralization, boundaries, hierarchy, collaboration, geographic footprint and sourcing. Each is a position between two defensible extremes, not a right answer.
| Slider | One extreme | The other |
|---|---|---|
| Centralization | Centralized control | Distributed autonomy |
| Boundaries | Closed and integrated | Open ecosystem |
| Hierarchy | Deep and narrow | Flat and wide |
| Collaboration | Mandated and formal | Emergent and informal |
| Geographic | Concentrated | Distributed |
| Sourcing | Build internally | Partner or buy |
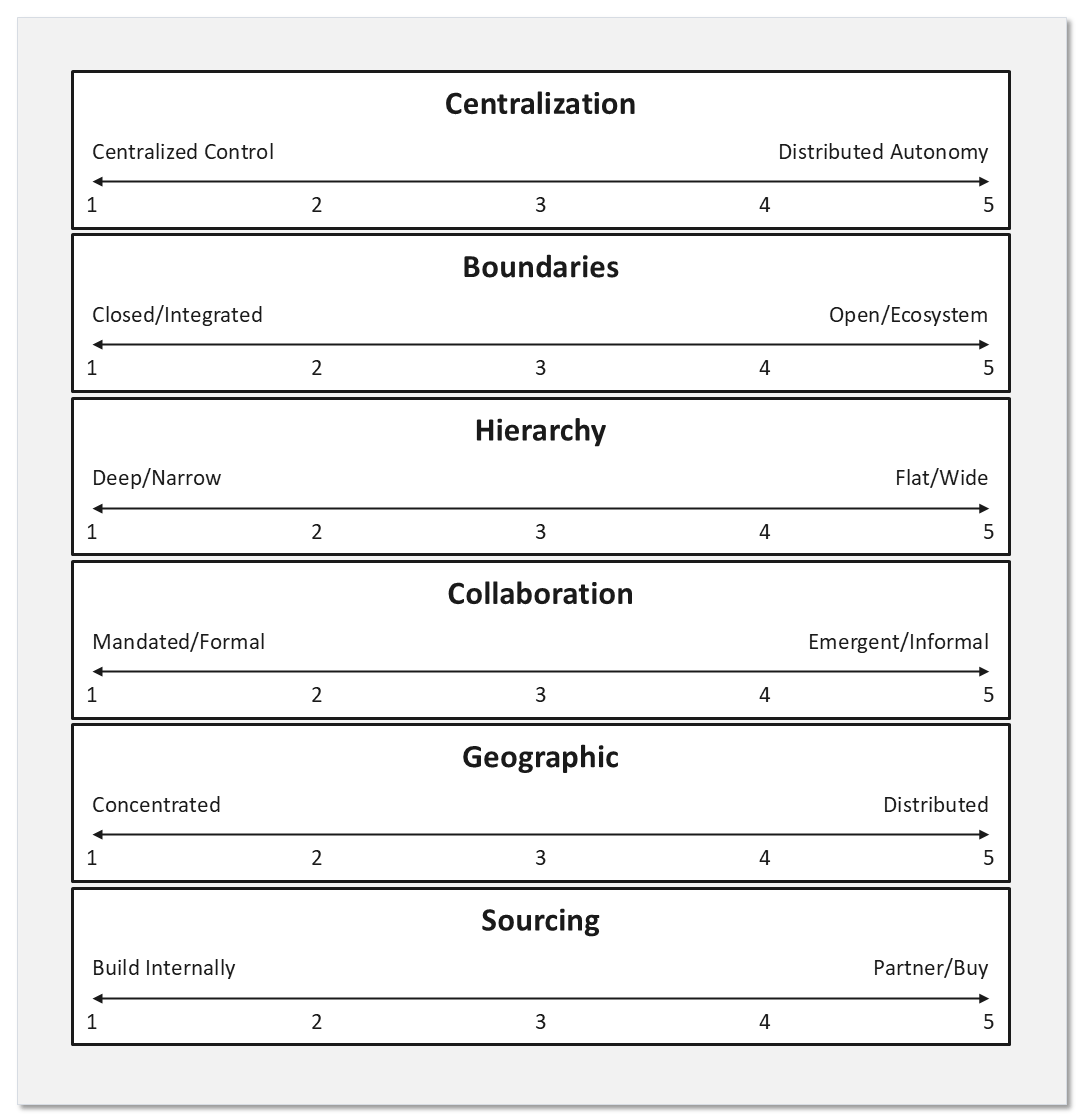
Record the archetype chosen, the evidence behind it, and the constraint it places on every other dimension. Positions clustered at the extremes usually signal an untested assumption rather than a bold choice.
Dimension 2Workforce: cultural archetypesPerformance orientation against leadership philosophy
Resolve what culture values define the organization, how talent and leadership are developed, and what employee experience is intended.
Competition culture
Clear targets, individual accountability, results focus. Seen in sales organizations, trading floors and startups.
Creation culture
Experimentation encouraged, failure accepted, learning valued, breakthrough seeking. Seen in R&D labs, design firms and technology companies.
Control culture
Hierarchical decision making, strict procedures, risk avoidance, compliance focus. Seen in government agencies, utilities and traditional banks.
Collaboration culture
Consensus decisions, team success, relationship focus, steady progress. Seen in healthcare, education and non-profits.
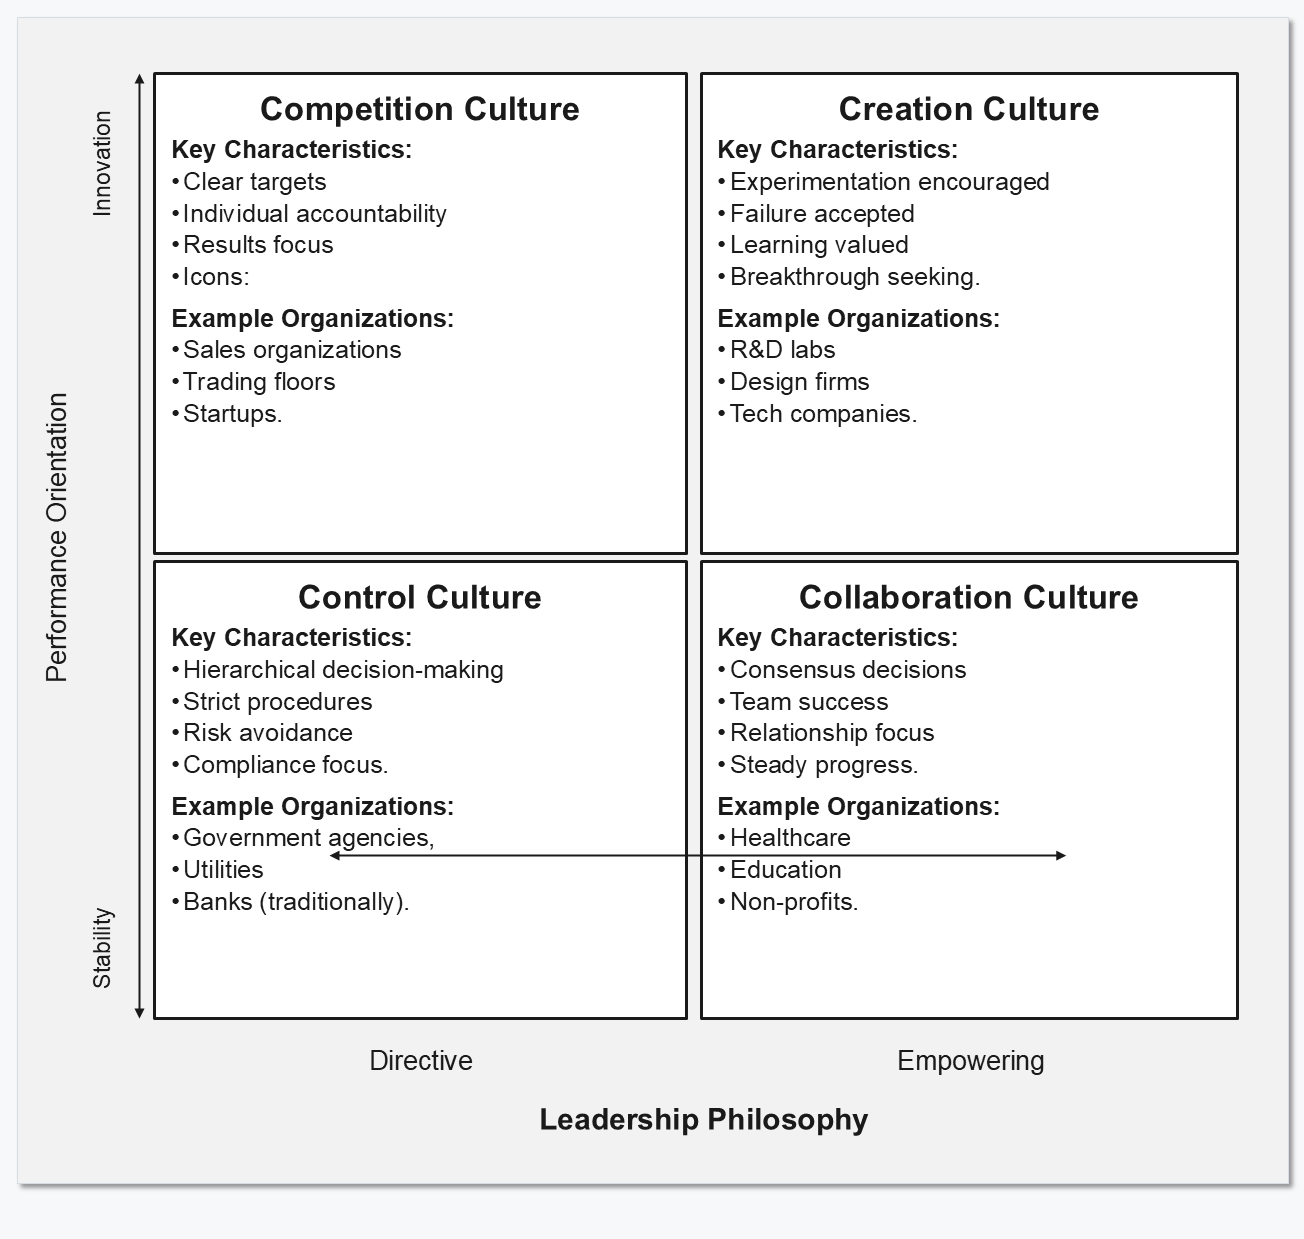
Culture is the dimension most often described aspirationally. Score it from the baseline evidence, not from the values page.
Worksheet 2 of 2Workforce philosophy analysis toolSix sliders
The same slider logic applied to people: where talent comes from, how it is developed, how performance is judged, how it is rewarded, how careers progress, and how flexibly work happens.
| Slider | One extreme | The other |
|---|---|---|
| Talent source | Build internally | Buy from market |
| Development focus | Deep specialization | Broad capability |
| Performance basis | Individual achievement | Team success |
| Reward philosophy | Fixed and hierarchical | Variable and performance based |
| Career model | Traditional ladder | Lattice or portfolio |
| Work flexibility | Fixed location and time | Fully flexible |
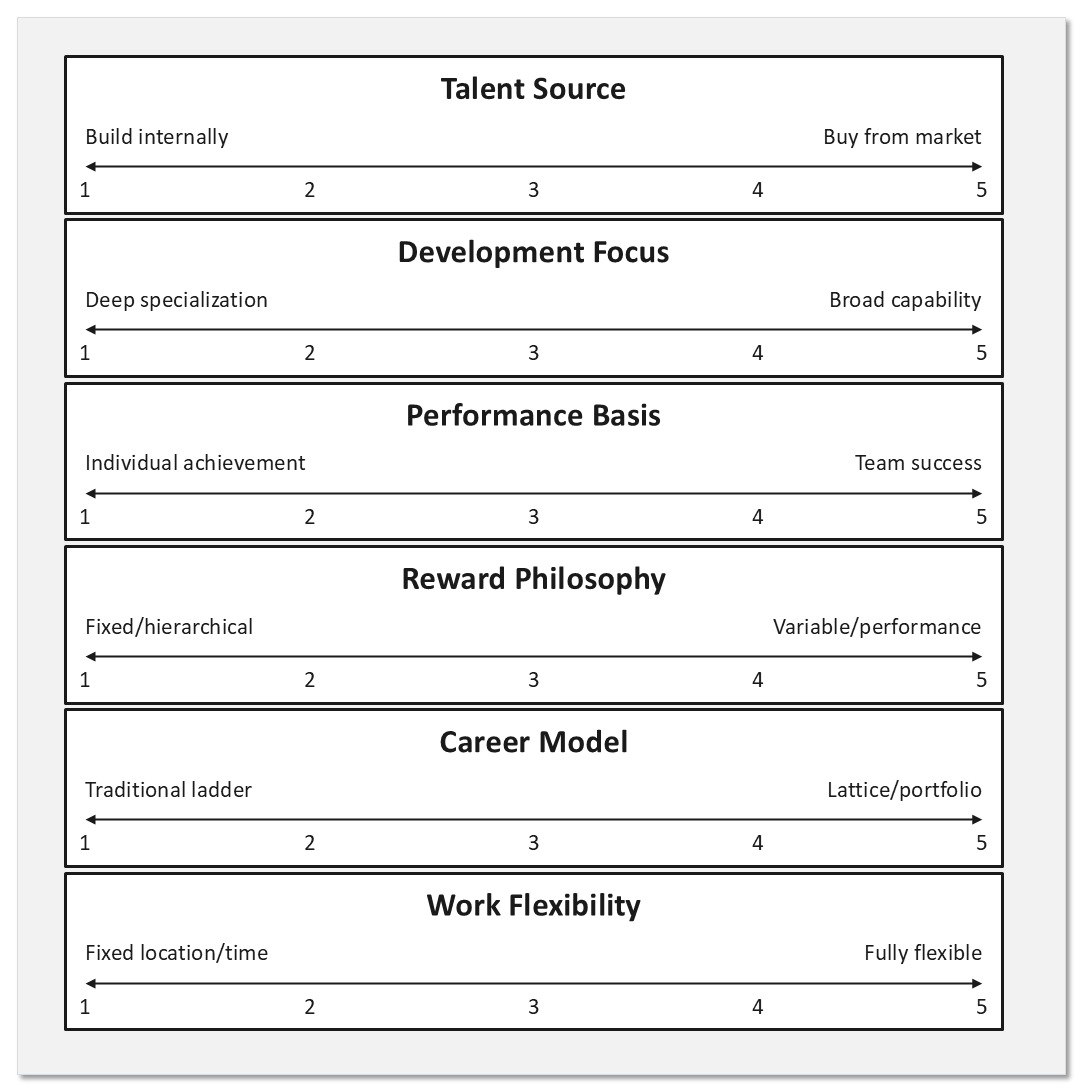
Mark current culture, intended culture, and the specific mechanisms that would move one to the other. A gap with no named mechanism is an aspiration rather than a plan.
Dimension 3Value: value stream archetypesProduct, journey or capability
Resolve how value creation activities are organized, whether the model is product, journey or capability oriented, and what principles govern the business model.
Product-centric
Value streams organized around products, focused on product lifecycles, with vertical integration of capabilities and product management ownership. Governed by product leadership on product-based metrics. Best for product-led companies and rapid innovation cycles.
Customer journey-centric
Value streams organized around journeys, focused on customer experience, with horizontal integration and journey owner accountability. Governed by journey owners with cross-functional coordination on experience-based metrics. Best for services businesses with complex customer interaction.
Capability-centric
Value streams organized by capabilities, focused on functional excellence, with functional leadership ownership. Governed on efficiency and quality metrics. Best for diverse portfolios, shared services models and economies of scale.
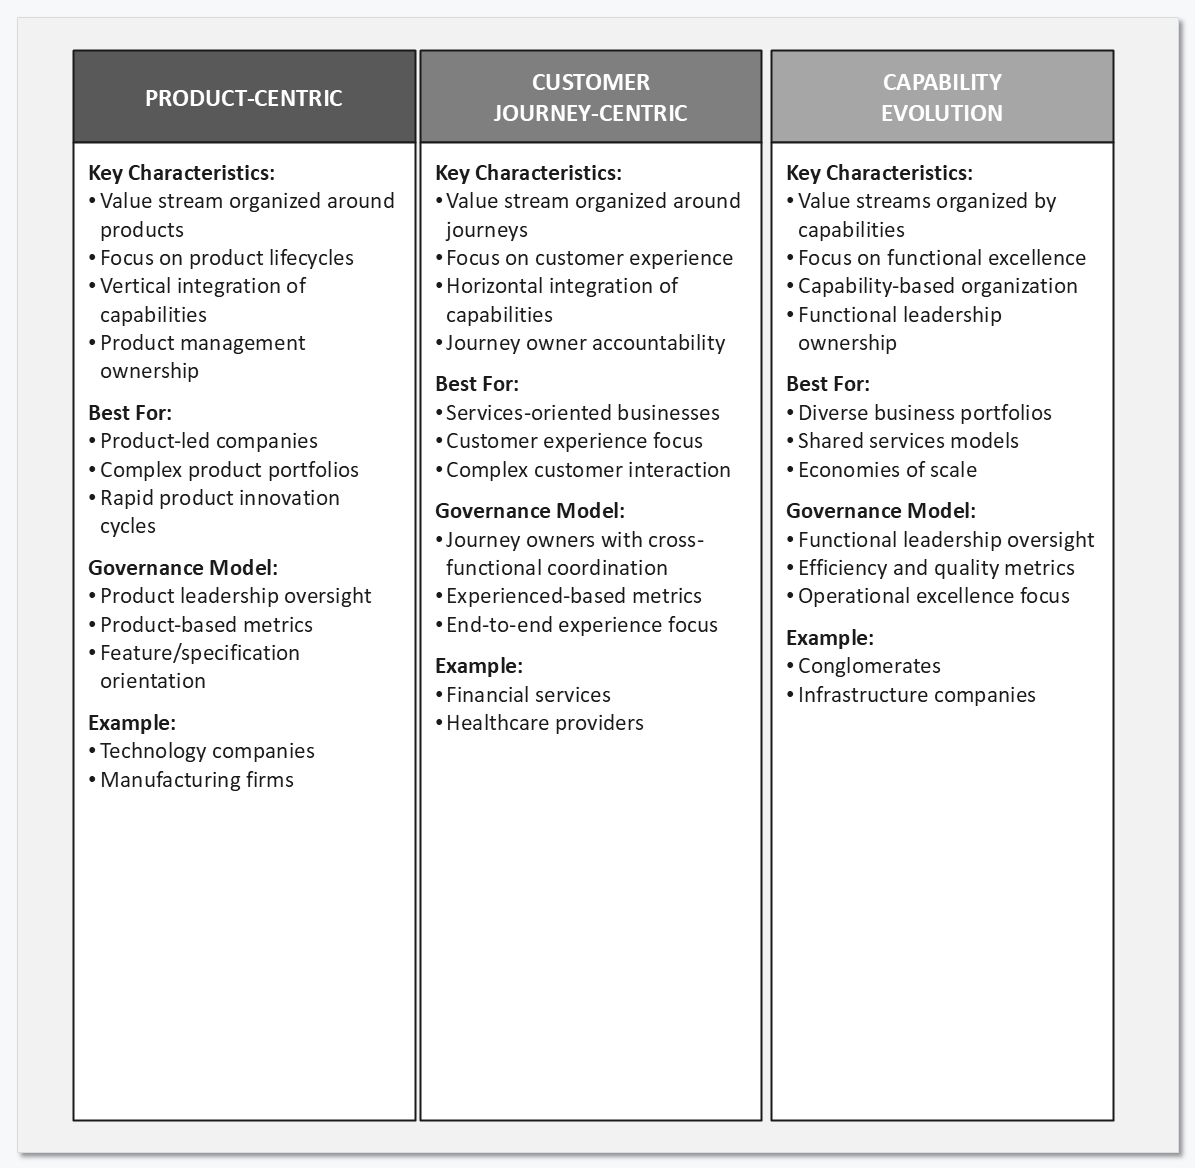
Two operating philosophies can coexist deliberately: an efficiency-led core with an experimentation-led growth business, provided the tension is named rather than averaged.
Dimension 4Digital: digital archetypesEnabler, differentiator or core capability
Resolve what the digital architecture looks like, how data and information are managed, and what principles guide AI and digital strategy. Four domains are each read across three levels of ambition: digital as an enabler that supports operations, as a differentiator that creates advantage, or as a core capability fundamental to the business model.
| Domain | Enabler | Differentiator | Core capability |
|---|---|---|---|
| Technology architecture | Standard technology stack, vendor packages, stability focused, limited customization. | Modular architecture, custom extensions, balanced priorities, strategic customization. | Proprietary architectures, custom-built systems, business model enablement, continuous evolution. |
| Data philosophy | Transactional records, standard reporting, limited integration, compliance focused. | Cross-functional data integration, insights driven. | Data products, data monetization, data-driven business model. |
| AI capabilities | Task automation, vendor AI solutions, cost reduction focus. | Intelligent process automation, customized AI models, decision augmentation. | Proprietary AI capabilities, AI products and services, AI-driven decision making. |
| Operating philosophy | IT as service provider, project-based delivery, service-level agreements, cost centre mentality. | IT as business partner, product-based delivery, business outcomes focused, value centre mentality. | Technology is the business, platform and product teams, revenue generator, DevOps and product culture. |
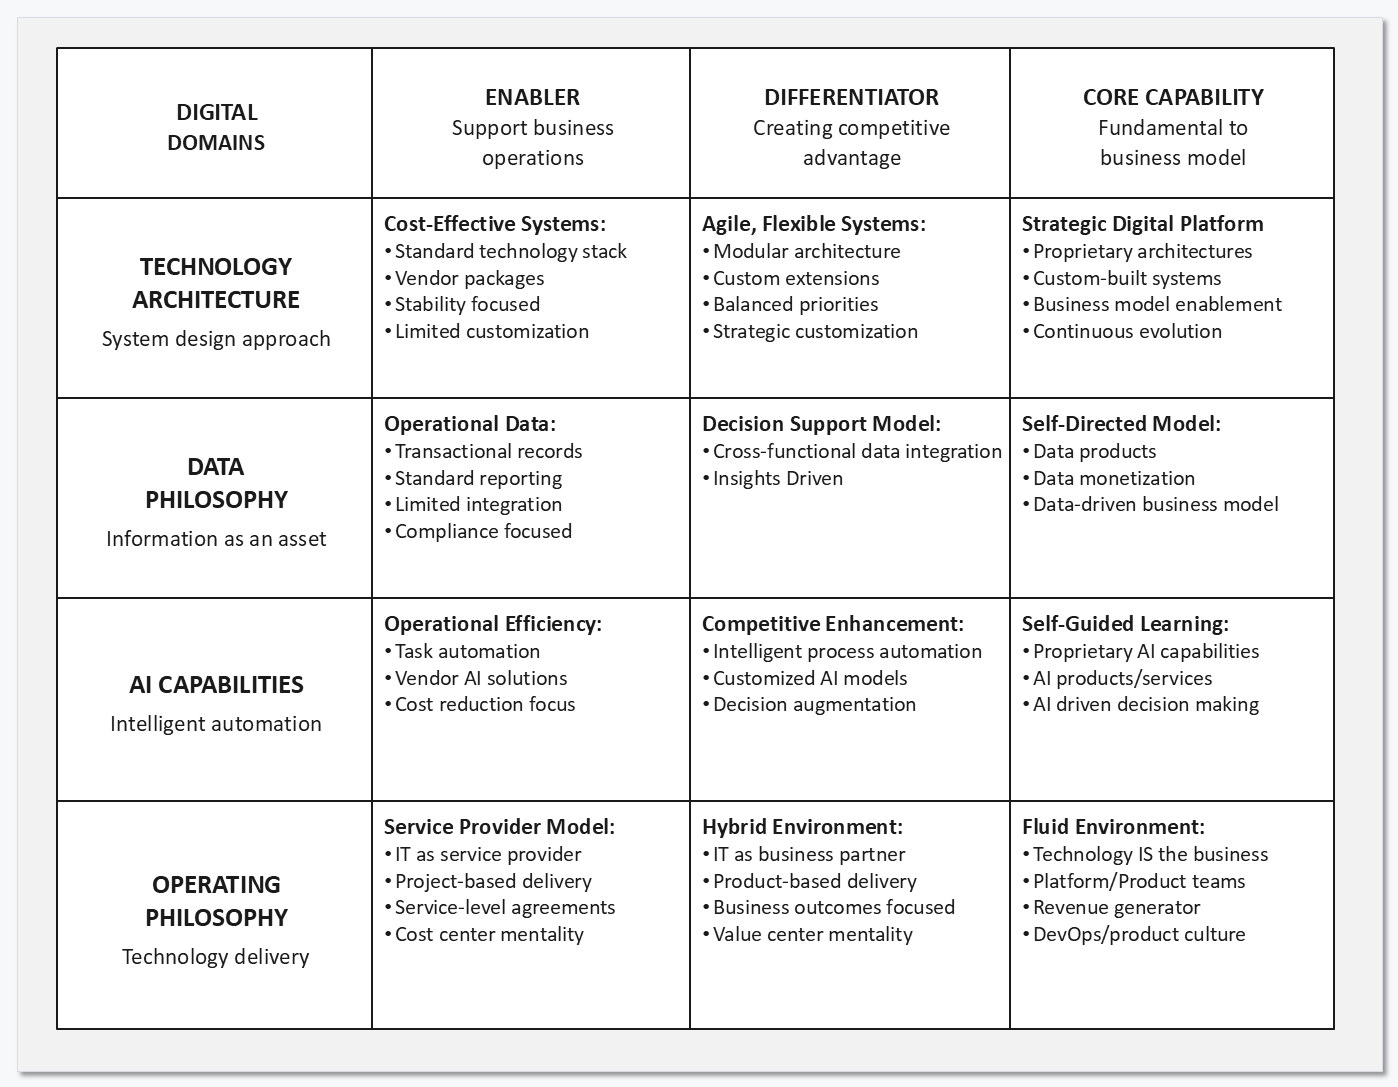
Dependencies run both ways: an autonomy-based organizational choice forces a modular technical architecture, and a monolithic estate forecloses team autonomy.
Dimension 5Management: management archetypesStability and control against agility and innovation
Resolve the approach to planning and performance management, the principles for resource allocation, and the balance between control and autonomy. Three archetypes sit on one spectrum: command and control, balanced matrix, and distributed autonomy.
| Philosophy | Command and control | Balanced matrix | Distributed autonomy |
|---|---|---|---|
| Planning | Top-down planning, annual planning cycles, detailed forecasting. | Participative planning, rolling forecasts, negotiated targets. | Adaptive planning, continuous forecasting, scenario-based planning. |
| Performance | Compliance and control, KPI measurement, variance management. | Balanced scorecard, multiple perspectives, leading indicators. | Outcome based, team objectives, customer-centric metrics. |
| Resource | Centralized allocation, budget driven, annual allocation. | Negotiated allocation, portfolio approach, quarterly adjustments. | Dynamic allocation, value-based prioritization, continuous reallocation. |
| Improvement | Top-down initiatives, centralized process design, programme based. | Structured improvement, Lean Six Sigma methods, centre of excellence supported. | Continuous adaptation, team-driven experiments, rapid learning cycles. |
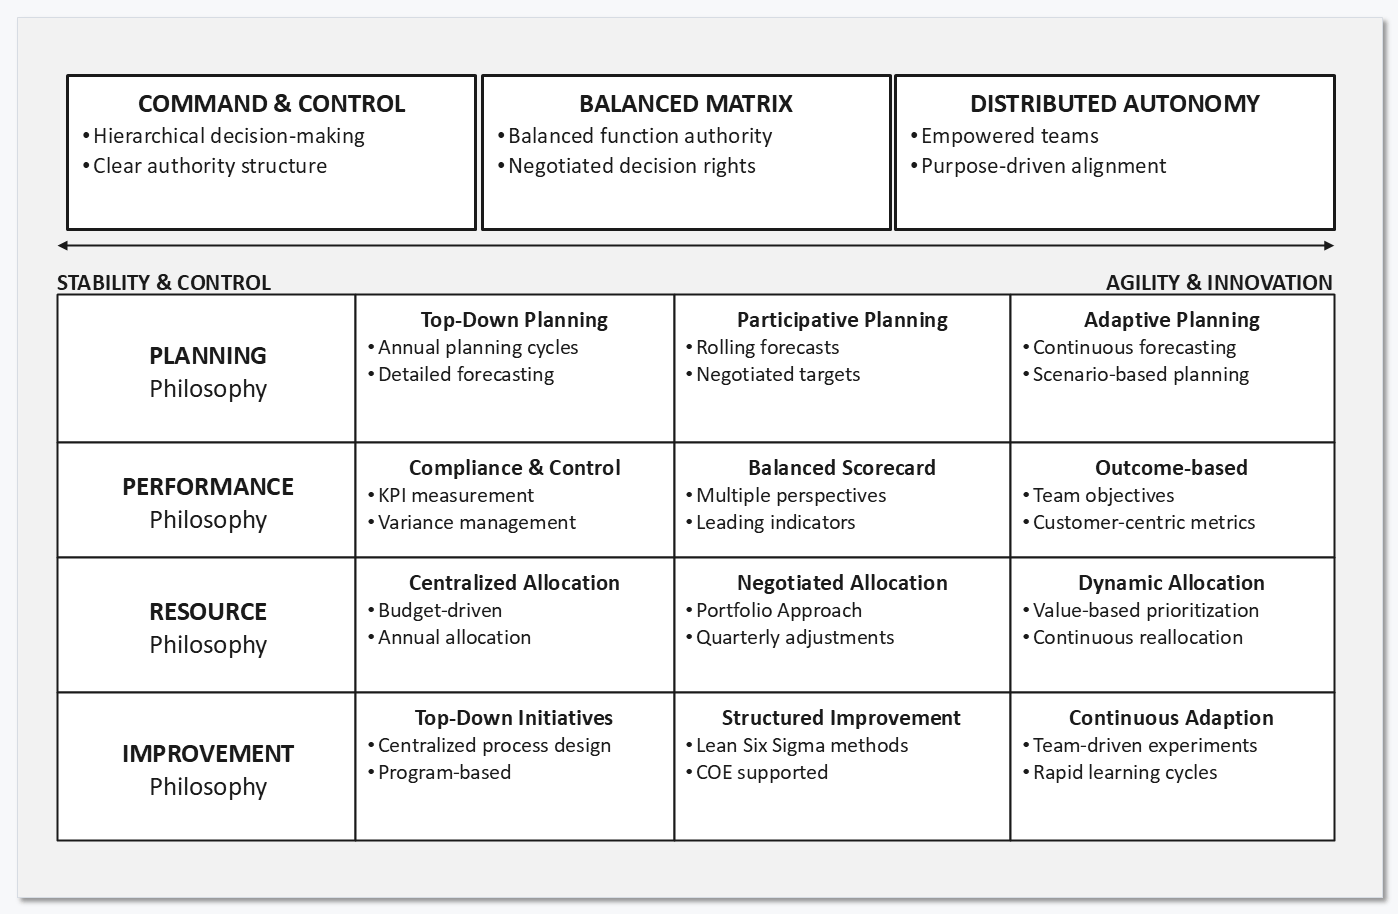
Control architecture is where a stated decentralization most often fails in practice: autonomy granted structurally and withdrawn through the budget cycle.
Dimension 6Governance: integrated governance modelDesigned last, deliberately
Resolve how sufficient accountability is ensured, what the approach to risk and compliance is, and how decisions are made and managed.
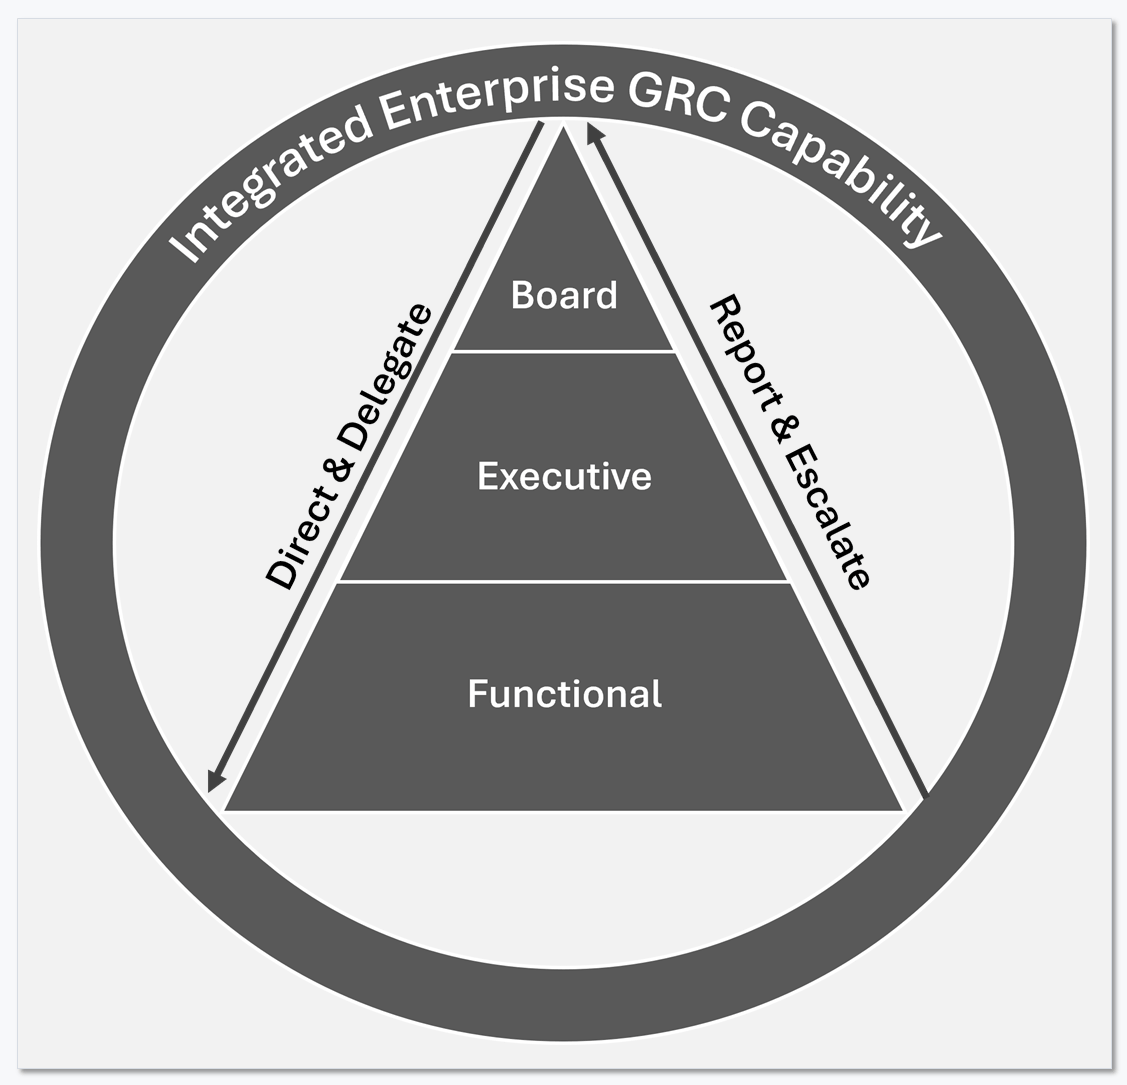
Governance is designed last in the conceptual layer because it must align to the other five choices, not constrain them in advance.
Principles and conceptual architecture.
Entry criteria
Establish North Star and Validate Baseline gates passed. Tension list drawn from real meeting history. Baseline heat map available to the design team. Ten house design principles accepted as guardrails.
Exit criteria
Five to eight client principles, each with a named cost and a worked decision. No unresolved collisions between principles. One archetype chosen per dimension with reasoning recorded. Tensions between dimensions classified as productive or paralysing. No fantasy combinations.
Deliverables
Design principles document with implications per function. Tension mapping canvas. Six conceptual architecture choices. Organizational and workforce philosophy tools. Dependency map across dimensions.
Reflection questions
Answer these before the principles and the conceptual architecture are signed off. They test whether the philosophy choices are real commitments or restatements of the current model in new language.
- Which of the ten principles would blow up your current decision making, and why?
- Which principle would your culture fight hardest? Name it and explain the resistance.
- Which architectural choice, centralized, federated or networked, best enables your intent?
- Which of the six dimensions is currently most misaligned with your strategic intent?
- How would a journey-centred rather than product-centred value model redraw your boundaries?
Turn philosophy into wiring diagrams, then into specifications.
Stage 4 runs the logical and detailed layers. Eight to twelve weeks elapsed, workstream leads full time. Most design failures are not wrong decisions; they are right decisions taken at the wrong level of detail.
Purpose
Turn philosophy into wiring diagrams, then into specifications a competent team can build from.
Inputs
Six conceptual choices with rationale, the cross-dimension dependency map, and the constraints the baseline exposed.
Activities
Five-step logical design across six blueprints, cross-dimensional integration checks, then detailed specification per dimension.
Outputs
Six logical blueprints, pattern menu, interface contract register, confidence map, specifications per dimension, design decision log.
The logical layer: six blueprints
The same six dimensions, now as wiring diagrams: linkages across the enterprise, people, capabilities, technology and data, execution, and oversight. Each blueprint answers how the pieces connect rather than what they are, so test every answer against a real decision the organization faces this quarter.
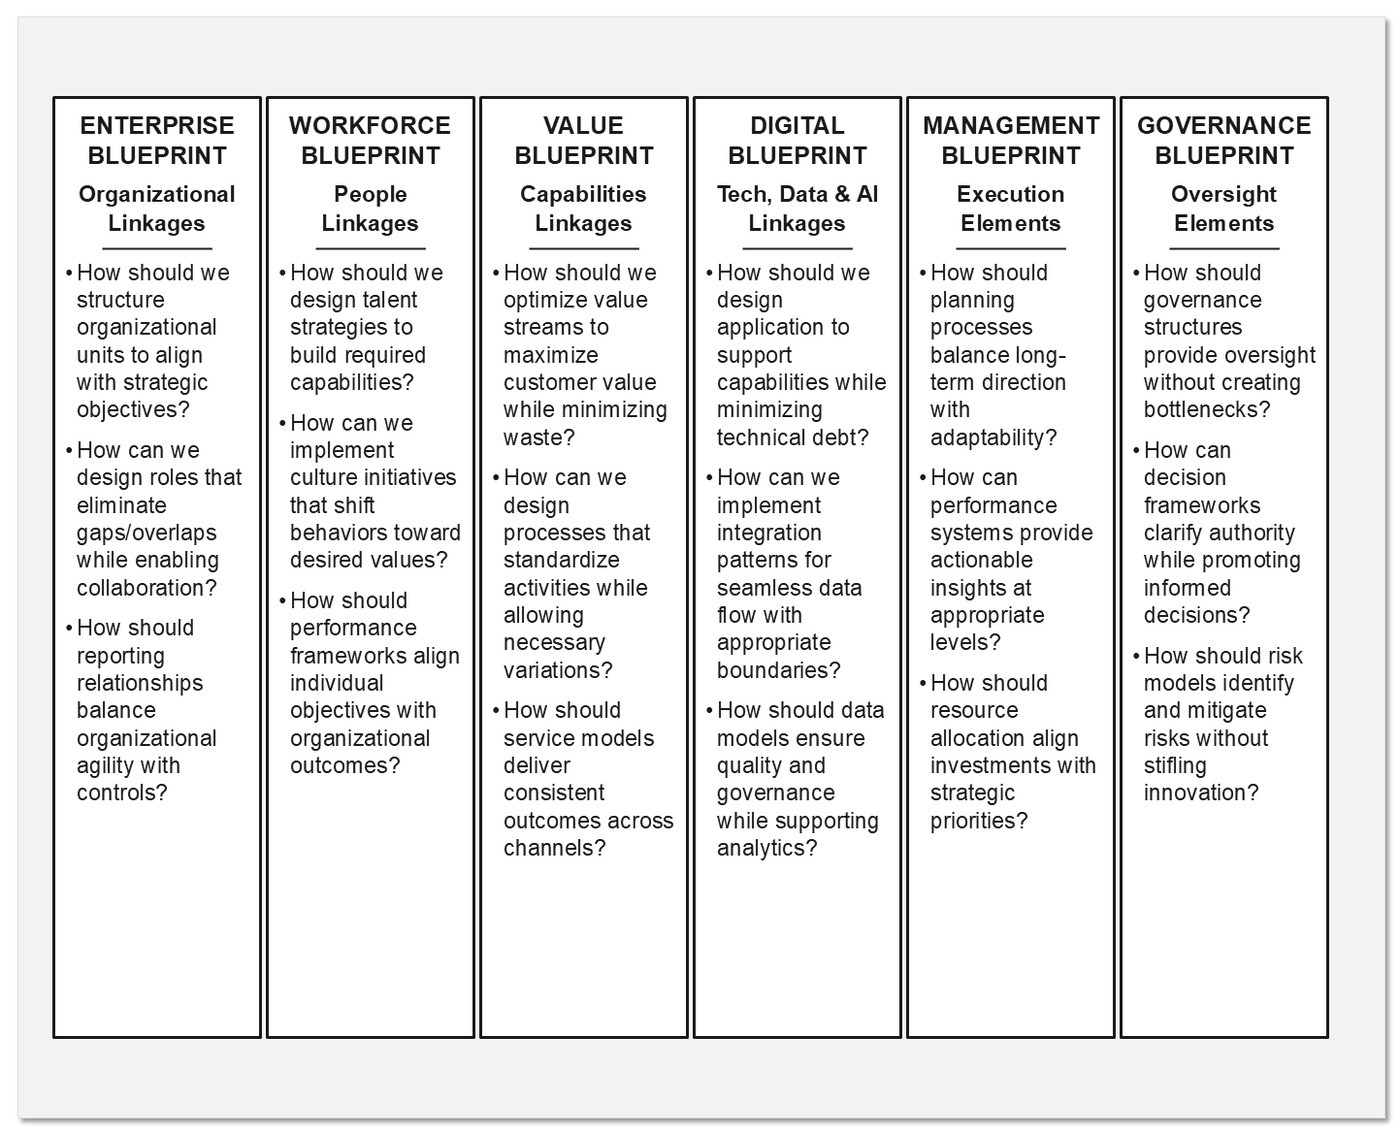
The five-step logical design process
Conceptual translation
Turn each philosophy choice into specific requirements. “Customer-centric” becomes named owners, named response times, one customer record.
Pattern definition
A short menu of standard patterns: four ways to integrate, not forty. Teams pick from the menu.
Interface design
What data flows where, when handoffs happen, how escalation works. Write them down and treat them as contracts.
Boundary setting
Who owns which class of decision. Matrixing everything is how decisions die in committee.
Integration validation
Run real decisions through the design. If two dimensions give different answers, fix it on paper, not in production.
The six blueprints in detail
Blueprint 1Organizational blueprintStructures, roles, relationships
The functional blueprint turns conceptual organizational choices into structures, roles and relationships. Not individual positions: the architecture itself. Skip it and you get an org chart that satisfies reporting requirements while creating the wrong dynamics.
Organization structure design
What are the major functions, units and primary relationships, and does the pattern implement the conceptual archetype?
Inter-unit interfaces and handoffs
Where are the critical connection points, and what interaction protocol governs each one?
Cross-functional structures
Which value stream teams or capability councils are permanent, and what decisions do they actually own?
Capability and value stream ownership
Which unit owns each core capability, and where is ownership contested or missing?
Shared services model
What is in scope, what is the interaction model, what service levels apply, and who signs them?
Reporting lines and relationships
What are the primary hierarchical and matrix lines, and where will matrix reporting create real conflict?
Role family architecture
How do related roles group for capability planning, and what career path architecture follows from that?
Location and sourcing model
What is the role and focus of each major site or hub, and how do we work with strategic partners and vendors?
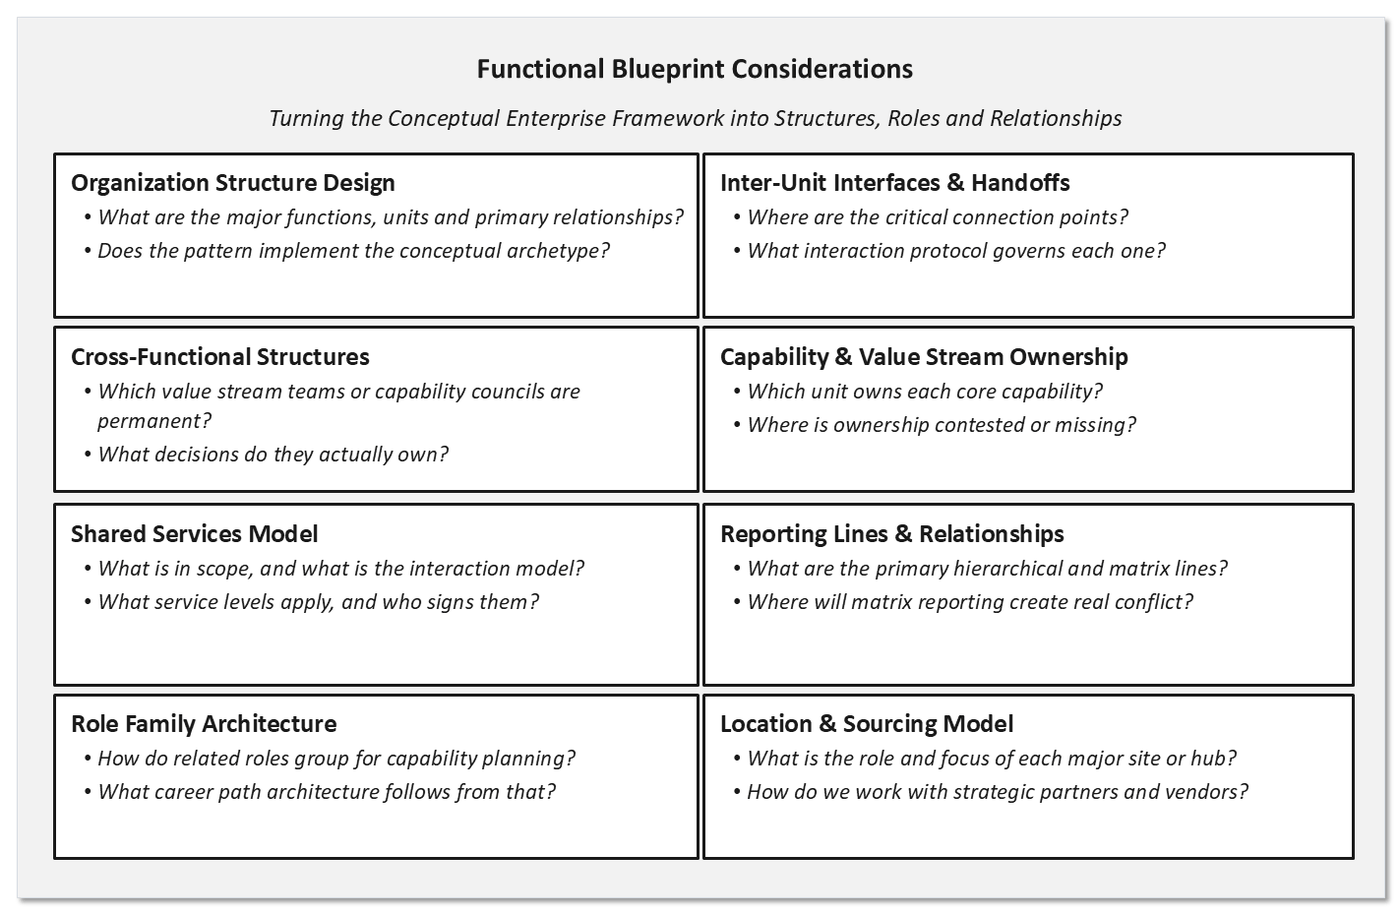
Structure follows capability ownership, not the reverse. Settle who owns which capability before drawing a single box.
Blueprint 2Workforce: employee experience canvasSeven lifecycle moments
Specify the designed experience across the lifecycle, the capability model behind each role family, and the mechanisms that move culture from current to intended.
| Moment | What the blueprint specifies |
|---|---|
| Attract and recruit | Employer value proposition, sourcing approaches, candidate experience, selection method. Cultural representation, values communication, diversity and inclusion, expectations setting. |
| Onboard and orient | Onboarding curriculum, skills assessment, initial development plan, learning technology access. Manager onboarding role, early feedback approach, integration support. |
| Perform and achieve | Goal-setting framework, feedback mechanism, performance reviews, performance improvement. Performance-based pay, achievement recognition, incentive structures. |
| Develop and grow | Capability framework, development pathways, learning modalities, knowledge sharing. Leadership pipeline, competency building, coaching framework. |
| Engage and connect | Values activation, community building, change management, communication practices. Total rewards approach, wellbeing initiatives, work flexibility. |
| Advance and lead | Career frameworks, succession planning, promotion process, stretch assignments. Leadership competencies, executive development, advanced leadership metrics. |
| Transition and alumni | Exit experience, knowledge transfer, alumni network, boomerang hiring. Transition dignity, organizational learning, legacy celebration, cultural reinforcement. |
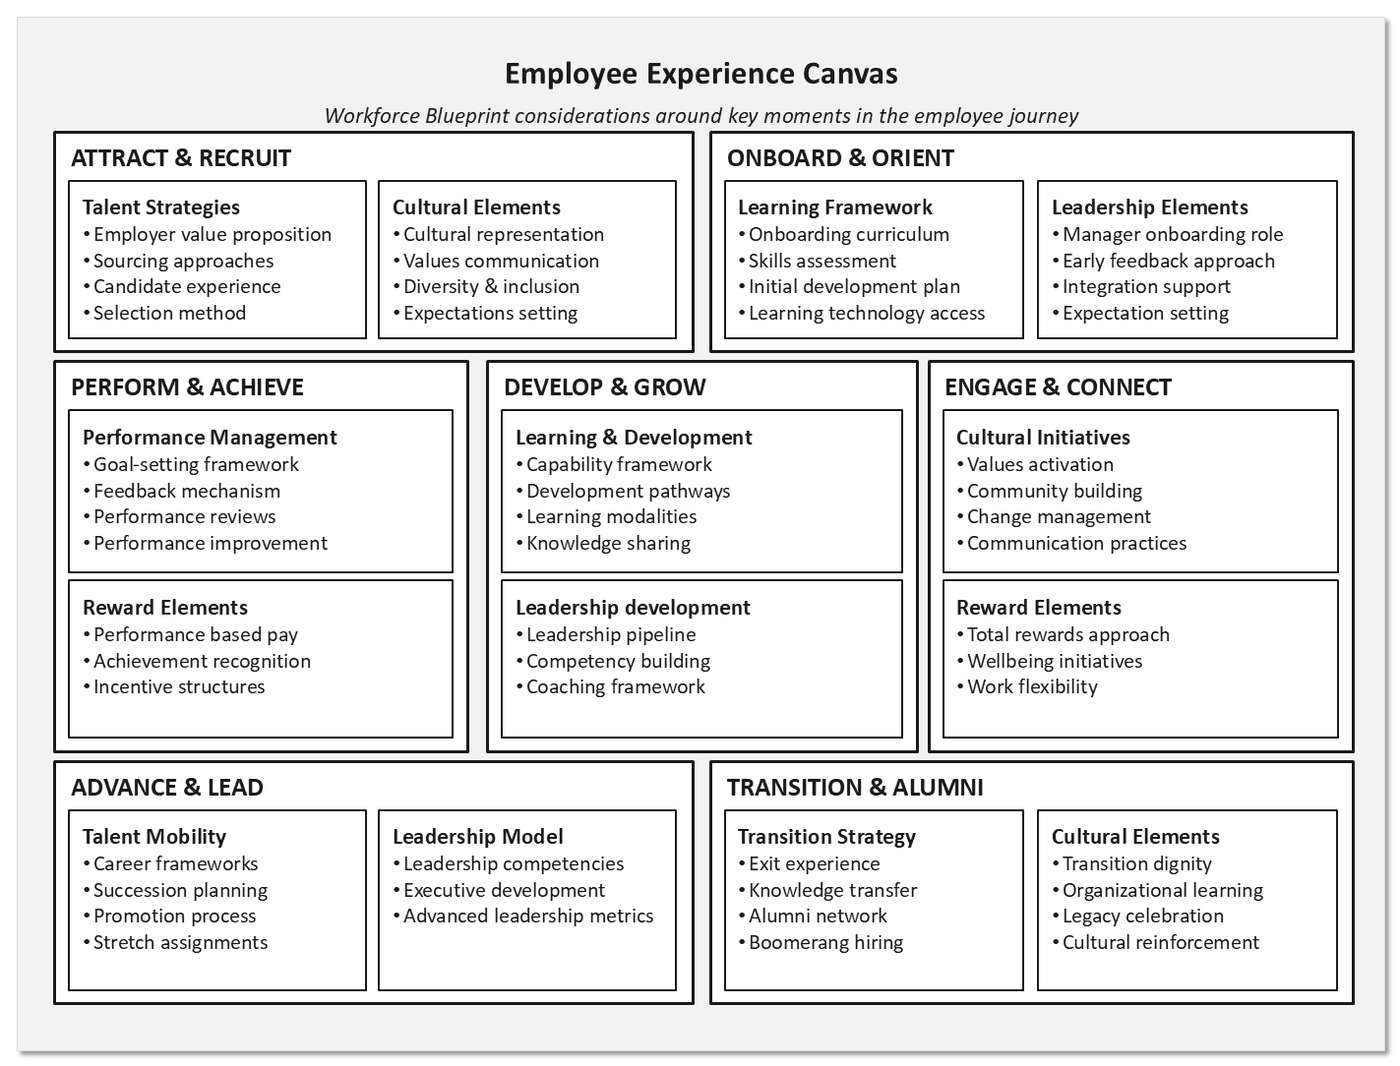
Check against the functional blueprint: a role that exists in the structure but not in the capability model will not be filled.
Blueprint 3Value flow considerationsEnd-to-end flow and control points
Specify end-to-end flow, handoff points, control points, service levels, and the automation boundary for each core capability.
Customer journey map
How do customers interact with our value streams, what are the key moments that matter, and where are the pain points and opportunities?
Strategic alignment
How do capabilities support strategic objectives, what value propositions are enabled, and what are the competitive differentiators?
End-to-end value stream maps
What are our primary value streams, how do they flow from customer need to fulfilment, and what are the critical dependencies between stages?
Key process definitions
What are our key processes, how do they relate to value streams, and which are core rather than supporting?
Handoffs and service levels
What are the key interfaces, what are the inputs and outputs, and what service levels define success?
Performance management
How do we measure process success, what are the critical KPIs, and how do we link them to outcomes?
Digital enablement
What is the mapping between value streams, processes and the digital technologies that enable them?
Organizational integration
Which functions support each value stream, and how are cross-functional teams organized?
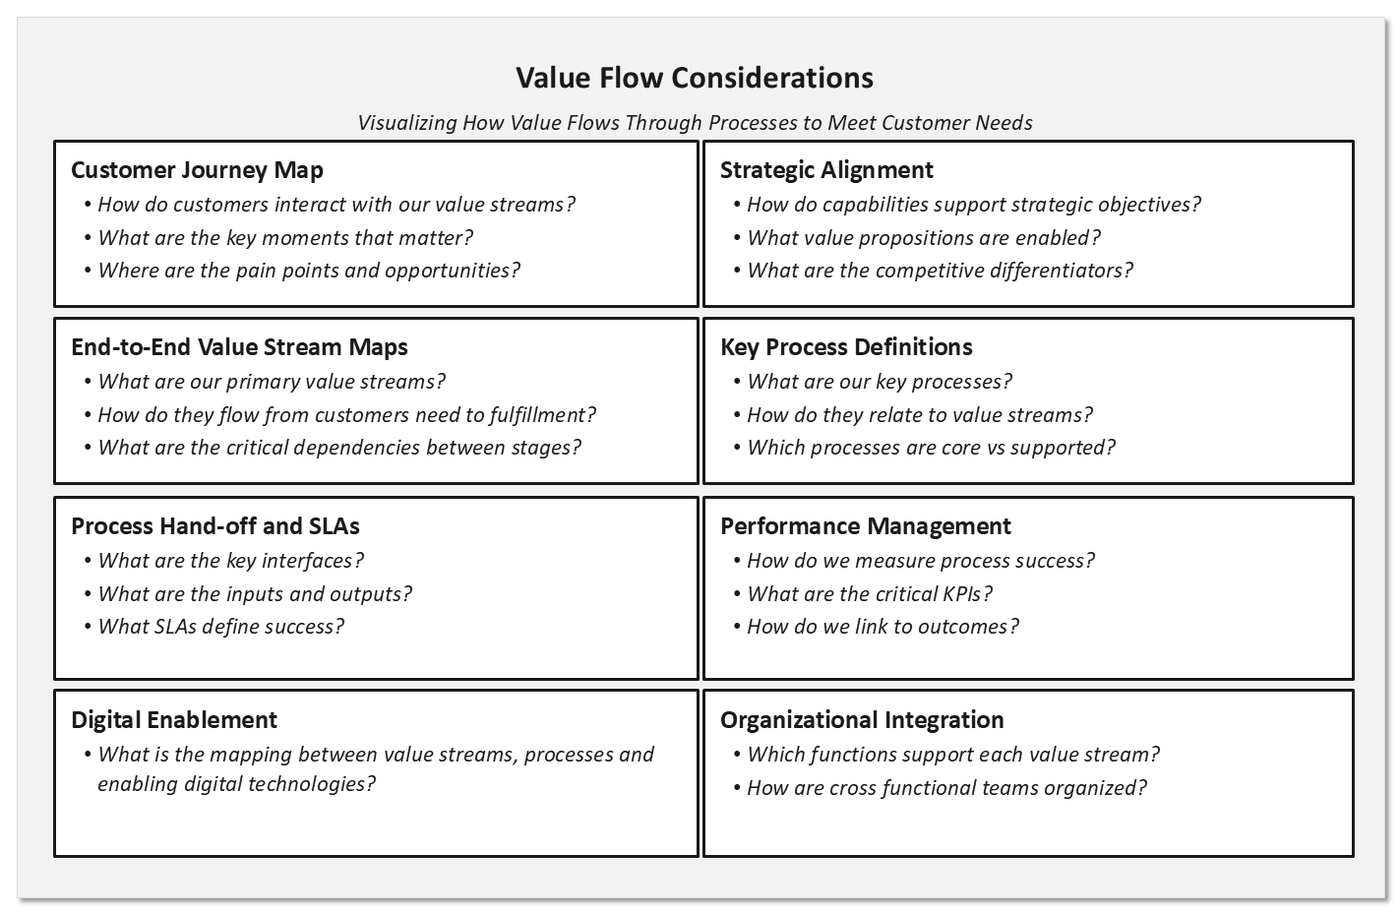
Sequence matters: optimize the manual process before digitizing it, or you automate the inefficiency.
Blueprint 4Digital blueprint considerationsApplications, data, integration, AI
Specify the application landscape, data model and ownership, integration patterns, and where AI is permitted to act rather than advise.
Technology foundation
How should platforms, application layers and infrastructure be designed to support the strategy? What cloud strategy balances flexibility, cost and control? Which standards and policies guide technical choices?
Security and resilience
What security zones and identity management approach protect our assets? Which data protection strategies apply? How is the technical approach designed for resilience and recovery against business continuity targets?
Application and capabilities
How do applications map to business capabilities and processes? What target portfolio strategy supports the business goals? How should application investments be prioritized in the roadmap?
Integration and connectivity
Which integration patterns take priority? What middleware and API platforms support those needs? How should key interfaces between systems be designed?
Data architecture and governance
What are the key data entities and their relationships? How should data flow through the organization? Who serves as data stewards and owners? What standards ensure data quality?
AI and automation
How should AI and automation integrate into the technology landscape? Which use cases take priority? What high-level solution designs deliver the most value?
Digital workplace
What tools and platforms enhance employee productivity? How should collaboration infrastructure be structured? Which digital workplace capabilities take priority?
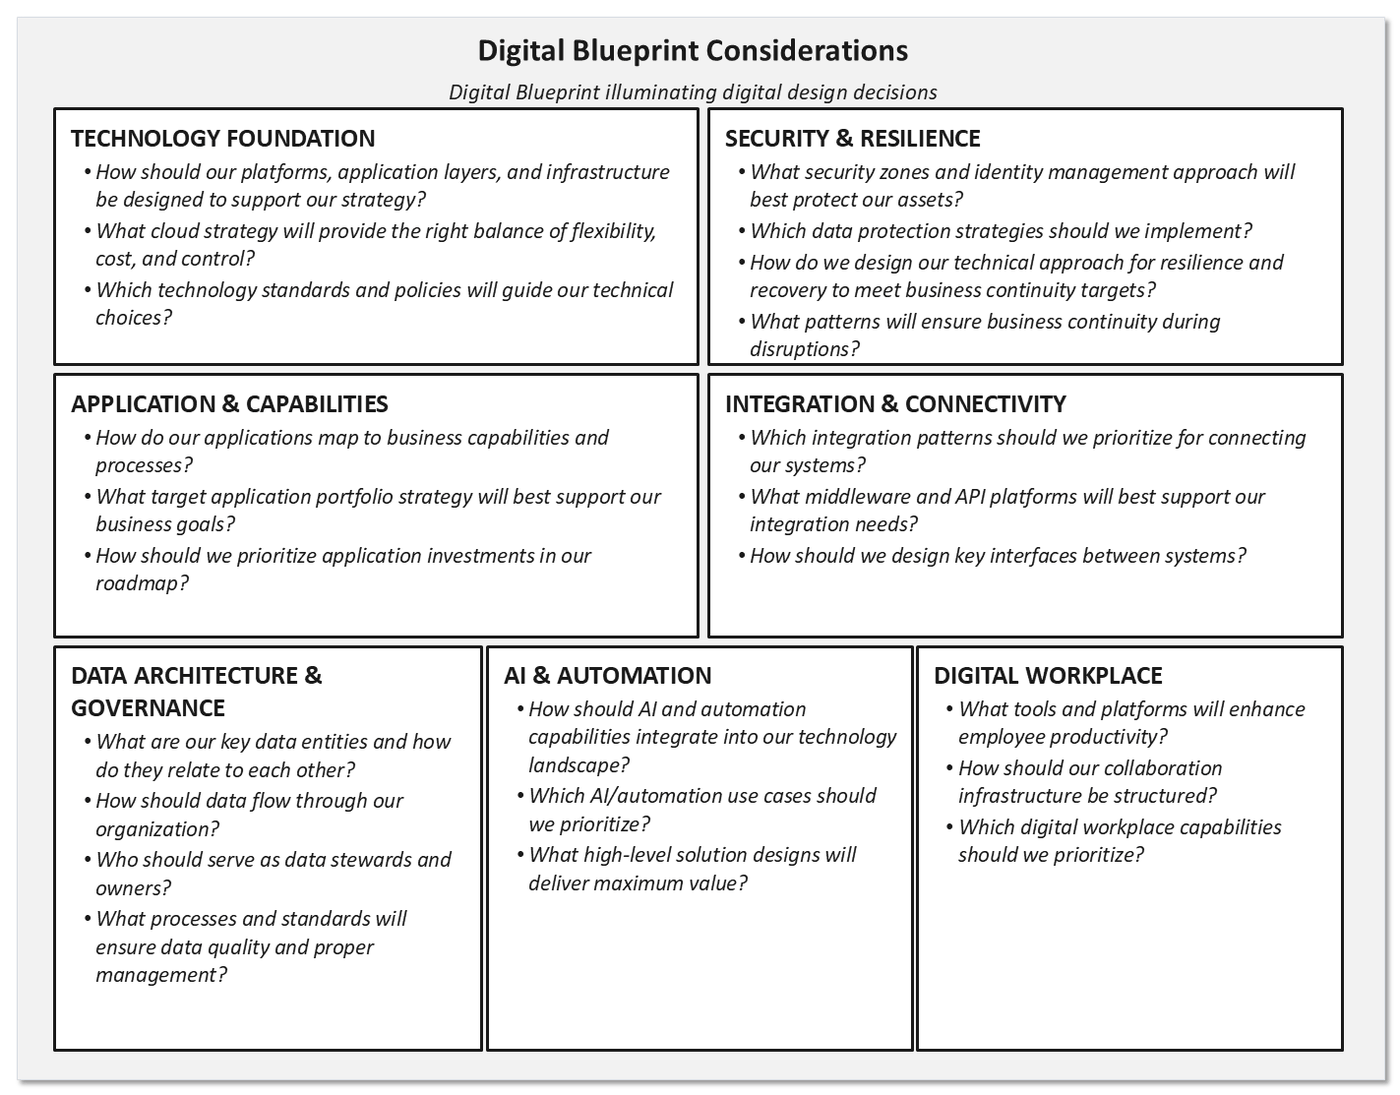
Technical dependencies are the rigid ones. A customer data platform has to exist before personalization can run on top of it.
Blueprint 5Management system considerationsThe organizational operating system
Specify the planning cycle, performance framework and metric hierarchy, the meeting architecture, and the resource allocation mechanism.
Strategic management
How do leadership forums establish and reinforce strategic priorities? What meeting rhythm ensures consistent strategy evaluation and adaptation? How is long-term vision balanced against near-term execution?
Integrated planning process
How are operational, financial and strategic planning cycles synchronized? Which cross-functional connections are critical? How is standardization balanced with flexibility?
Resource allocation mechanisms
What decision criteria guide allocation to the highest-value activities? How is maintaining existing capability balanced against building new? What process allows reallocation as conditions change?
Decision architecture
What types of decisions benefit from standardized workflows? How are decision rights and accountabilities defined? What approval thresholds balance empowerment with oversight?
Initiative management
What methodology guides project selection, prioritization and execution? How is portfolio visibility maintained and interdependency managed? What balance of centralized and decentralized governance is optimal?
Information and reporting
What information and insight must flow to each management level? How is comprehensive data balanced against actionable insight? What technology enables efficient delivery?
Continuous improvement
How is learning captured systematically? What process converts insight into improvement initiatives? How are incentives created for knowledge sharing?
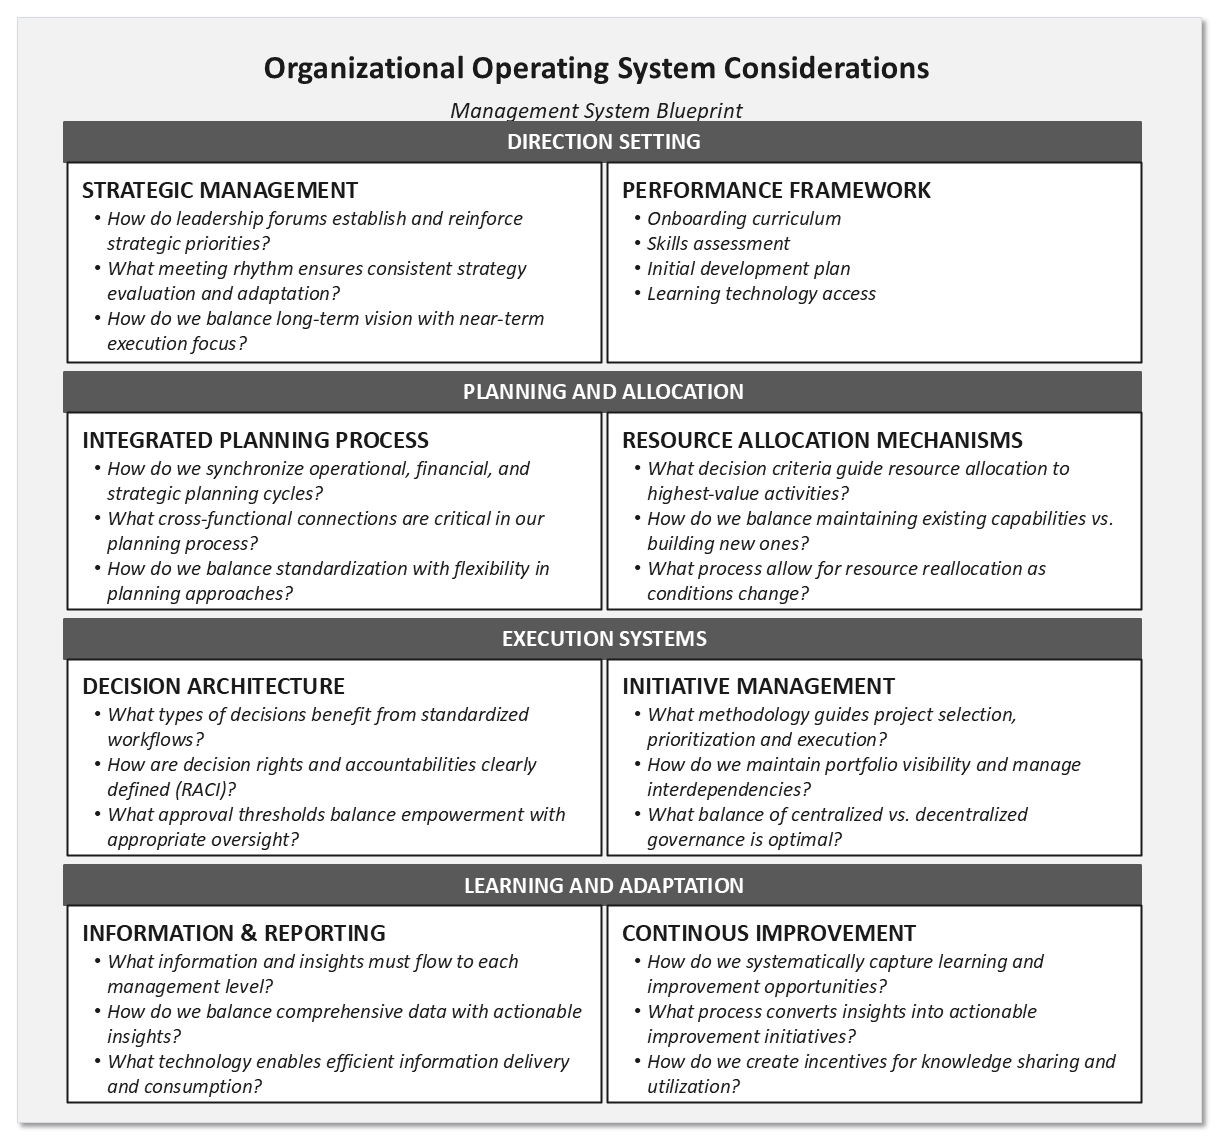
This is the blueprint that decides whether the autonomy promised in the conceptual layer survives contact with the budget cycle.
Blueprint 6Governance blueprint considerationsDecision rights and assurance
Specify decision rights by class of decision, the committee architecture with real owned decisions, the control framework proportionate to risk, and escalation with time limits.
Authority and decision structures
How are decision-making, consultation and information rights defined? What committee structure addresses the key risk areas? What financial and operational authority limits exist at each level?
Risk and control environment
How are risks identified, assessed and managed systematically? How are evolving regulatory obligations tracked and met? What control framework aligns with operational needs?
Policy and information flows
What process keeps policies current and effective? What information should flow to each governance body? What triggers and timelines drive issue escalation?
Assurance and effectiveness
How are internal audit, compliance and management verification coordinated? What governance metrics provide meaningful board oversight? How is remediation tracked and verified?
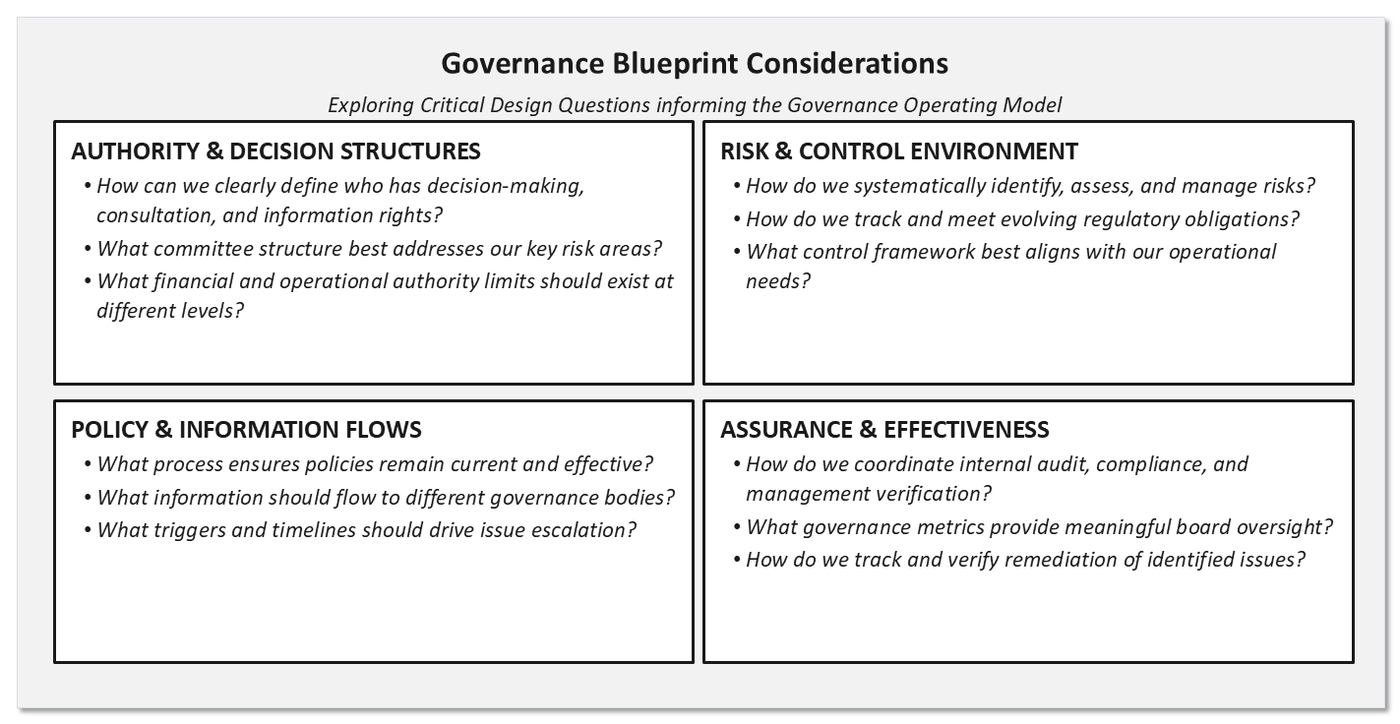
Every committee in the target design should own at least three real decisions. If it cannot, it does not belong in the blueprint.
Confidence first, then six integration checks.
Blueprints drawn dimension by dimension will contradict each other. The confidence map records what is still assumed, and the integration checks find the contradictions on paper.
WorksheetBlueprint confidence mapOne box per blueprint
Record what is specified, what is still assumed, and the evidence that would close the gap. A blueprint nobody can challenge has not been reviewed.
Functional
Which structures, roles and relationships are specified, and which are still assumed?
Workforce
Which parts of the designed experience and capability model rest on evidence rather than intent?
Value
Where are flow, handoffs, control points and the automation boundary still undecided?
Digital
Which application, data and integration decisions are settled, and where is AI authority unclear?
Management
Which planning, performance and allocation mechanisms would survive first contact with delivery?
Governance
Which decision rights are owned by a named body, and which committees own nothing real?
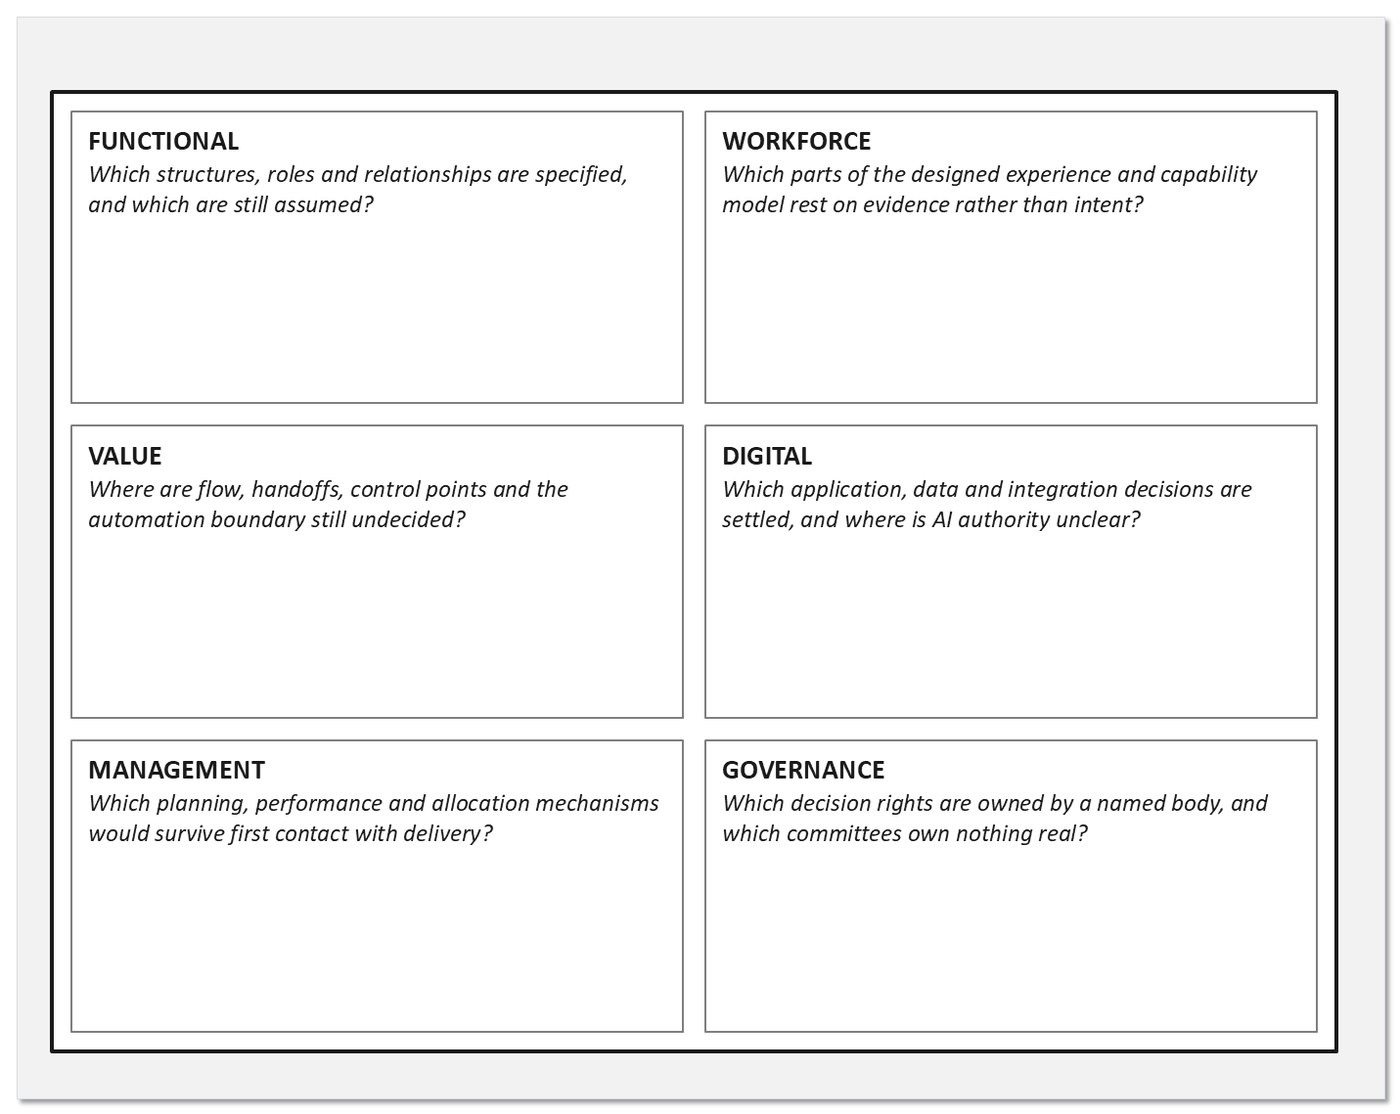
Run this after the six blueprints are drafted and before cross-dimensional checks. Low confidence is not a failure; an unrecorded assumption is.
Cross-dimensional integration checks
Data ownership
Does the technology design assume shared data while the management design creates units that hoard it?
Authority and ownership
Does every capability have one primary owner, with decision rights that match the accountability?
Interface completeness
Is every handoff between dimensions written down as a contract, with data, timing and escalation?
Capability feasibility
Do the skills the design assumes exist today, or is there a build plan with the right lead time?
Scenario test
Run three real scenarios end to end. If two dimensions answer differently, the design is not finished.
Principle conformance
Does each blueprint decision trace to a design principle, or is it a preference that slipped in?
Specify to the level at which the next person can act.
Layer three turns blueprints into specifications: roles and decision rights, competencies and metrics, step-by-step process detail, data models and interfaces, management calendars and KPI definitions, and committee charters.
| Dimension | What detailed design specifies |
|---|---|
| Enterprise | What specific roles are required, and precisely what responsibilities and decision rights do they carry? How will handoffs and interfaces between key roles and teams function in detail? How will reporting lines operate day to day, especially for matrixed or shared service roles? |
| Workforce | What competencies does each critical role require, and how will current capability be assessed against them? What specific metrics will measure individual and team performance? What training programmes are needed, with what curriculum and delivery approach? |
| Value | What step-by-step procedures and work instructions do the critical processes require? Where are the control points in each process and what specific controls are needed? What operational metrics track process performance? |
| Digital | What do the detailed data models look like, including fields, validation rules and data ownership? What technical specifications apply to key system interfaces, such as APIs and data mapping rules? What digital standards must be implemented across systems and data? |
| Management | What is the structure for management meetings, their purpose, agenda, attendees and cadence? How will budgeting and forecasting work, including timelines and approval stages? For each KPI, what is its precise definition, calculation method, target and owner? |
| Governance | Who holds which decision rights for key operational, financial and strategic decisions? What is the specific charter for each governance committee, its members, scope of authority and frequency? What compliance checks are required, how often, by whom, and using what method? |
Work one column at a time, but validate across columns before signing any of them off. A specification that contradicts another column is far cheaper to find here than in implementation.
How much detail is enough
Trap 1: paralysis by detail
Specifying everything before anything ships. The documentation becomes the deliverable and the operating model never operates.
Trap 2: strategic vagueness
Leaving the specifics to implementation teams, who then improvise six incompatible answers to the same question.
Modular specificity
Specify interfaces tightly and internals loosely. A module can be rebuilt without renegotiating the system as long as its contract holds.
Five ways detailed design fails
Everyone accepts they need specifications. The same five mistakes then appear, whether the work is manufacturing operations or digital services.
| Pitfall | What goes wrong | The fix |
|---|---|---|
| Over-specification | Five hundred pages specifying which font to use in emails. By the time it is finished the specification describes a company that no longer exists. | Put precision where it matters: critical interfaces and regulated steps. Guidelines everywhere else. Structure specs so one component can change without rewriting the whole. |
| Specification silos | HR writes its procedures, IT writes its own, Operations does its thing. Implementation starts and the handoffs do not work. | Integrated design teams and forced cross-dimension reviews. Each team must specify exactly how its piece connects to the others. |
| Blueprint disconnection | Six months on, the specs bear no resemblance to the logical design. Architectural integrity was traded for immediate fixes. | Traceability from blueprint to specification, plus scheduled alignment reviews. Verify the detail actually implements the design. |
| Implementation impracticality | Procedures assume resources you do not have, systems need skills nobody holds, timelines ignore physics. | Put implementation teams in the reviews and walk the design step by step against real scenarios. If the people who must run it say it will not work, believe them. |
| Static design mentality | Specifications assume conditions never change, so every shift in the business demands a full redesign. | Separate fixed from flexible elements explicitly, and attach a named review trigger to each flexible one. |
Implementation readiness checklist
| Dimension | Specified and testable | Evidence at the gate |
|---|---|---|
| Enterprise | Roles, responsibilities, decision rights, handoffs, reporting lines, locations. | Named incumbents or open requisitions for every critical role. |
| Workforce | Competency profiles, assessment method, training curriculum, reward design. | Gap analysis against current population, with lead times. |
| Value | Procedures, work instructions, control points, operational metrics, service levels. | One end-to-end dry run completed with real transactions. |
| Digital | Data models, field-level ownership, interface specs, deployment and rollback. | Rollback tested, not just documented. |
| Management | Meeting structures, reporting templates, budget process, KPI definitions. | Each KPI has a calculation method, target and named owner. |
| Governance | Policies, committee charters, compliance checks, audit protocols. | Every charter lists the decisions the body owns. |
Design ready to build.
Entry criteria
Conceptual choices signed. Pattern menu agreed. Confidence levels marked on every blueprint element, with the red list treated as design risk.
Exit criteria
Six integration checks passed. Three scenarios run end to end with consistent answers. Readiness checklist evidenced, not asserted. Rollback tested. Every critical role has a name or a requisition.
Deliverables
Six logical blueprints. Interface contract register. Detailed specifications per dimension. Implementation readiness checklist with evidence. Design decision log with rationale.
Reflection questions
Answer these before the design is handed to build. They test whether the blueprints and specifications hold together, and whether the detail you have written can survive its first contact with reality.
- Where do disconnects exist between your conceptual choices and your actual structures?
- Which integration patterns between the six dimensions are missing or poorly defined?
- Where do you over-specify flexible elements while under-specifying critical interfaces?
- Which specifications constrain adaptation that could become guidelines with boundaries?
- How might stable interfaces let components evolve internally without external disruption?
Pay back in stages, not at a single go-live.
Stage 5 converts the design into sequenced delivery. Six to eight weeks to architect it, then continuous through delivery. Most transformations fall short of their goals, and the shortfall is usually located here rather than in the design.
Purpose
Convert the design into sequenced delivery that pays back in stages rather than at a single go-live.
Inputs
Approved design, readiness checklist with evidence, capacity and capability data, the approved business case.
Activities
Decompose and prioritize on value and complexity, design plateaus, stand up the TMO and scorecard, run 90-day value sprints.
Outputs
Integrated roadmap in four views, prioritized portfolio, plateau definitions, benefits realization matrix, scorecard pack.
Three phases of execution
Architecting the journey
Decompose the design into initiatives, map dependencies, prioritize on value and complexity, design plateaus, build the integrated roadmap.
Orchestrating execution
Stand up the TMO, the scorecard and the tiered governance bodies, and run them on a defined operating rhythm.
Activating value
Manage benefits to named owners, capture early value in 90-day sprints, and transfer capability to the permanent organization.
Decomposition and the four dependencies
Technical
Which systems must exist before others can function. Rigid: violation causes failure, not delay.
Process
Which workflows must be redesigned before automation. Otherwise you automate inefficiency.
Organizational
Which structures must exist before new processes can run. Roles before accountability, accountability before decision rights.
Capability
Which skills must be built before new tools deliver value. Data literacy before analytics, agile capability before iterative delivery.
Where initiatives come from: enterprise yields restructuring, boundary and partnership initiatives. Workforce yields talent, capability, culture and performance-system work. Value yields process, automation and experience work. Digital yields platform, data and analytics work. Management yields measurement and rhythm work. Governance yields risk, compliance and decision-rights work. Cross-dimensional initiatives sit at the intersections and usually determine the outcome.
WorksheetValue-complexity canvasSorting the backlog
Four quadrants sort the implementation backlog: quick wins to take now, strategic investments worth the effort, low-hanging fruit to pick up cheaply, and value traps to avoid.
Quick wins · high value, low complexity
What high-impact initiatives can we implement quickly with current resources?
Strategic investments · high value, high complexity
Which complex initiatives justify significant resource investment because of their long-term value?
Low-hanging fruit · low value, low complexity
Are there simple improvements worth making with minimal effort?
Value traps · low value, high complexity
Which complex initiatives should we avoid or reconsider because returns are limited?
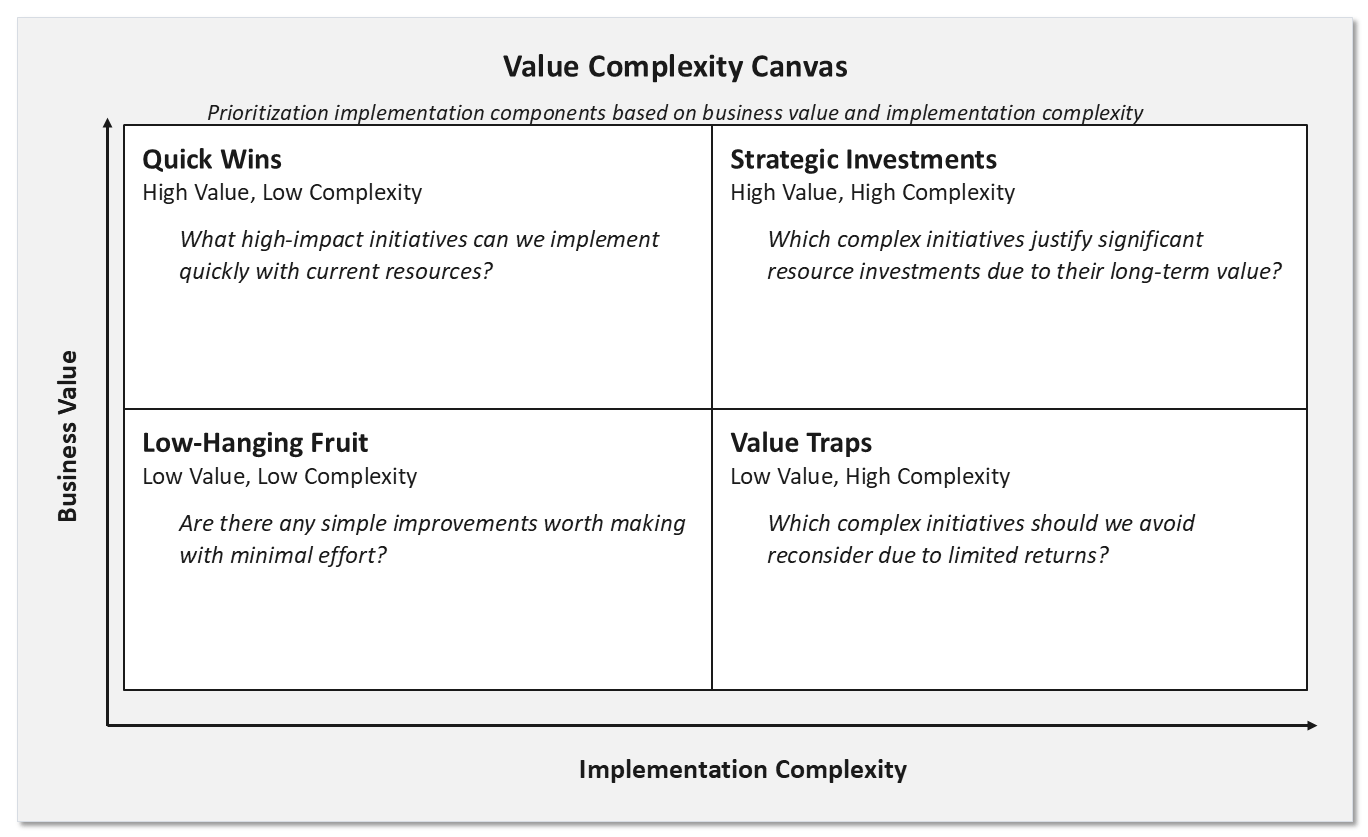
Value means financial, strategic and speed to value. Complexity means technical, organizational and operational. Organizational complexity predicts trouble better than technical complexity, so weight it accordingly.
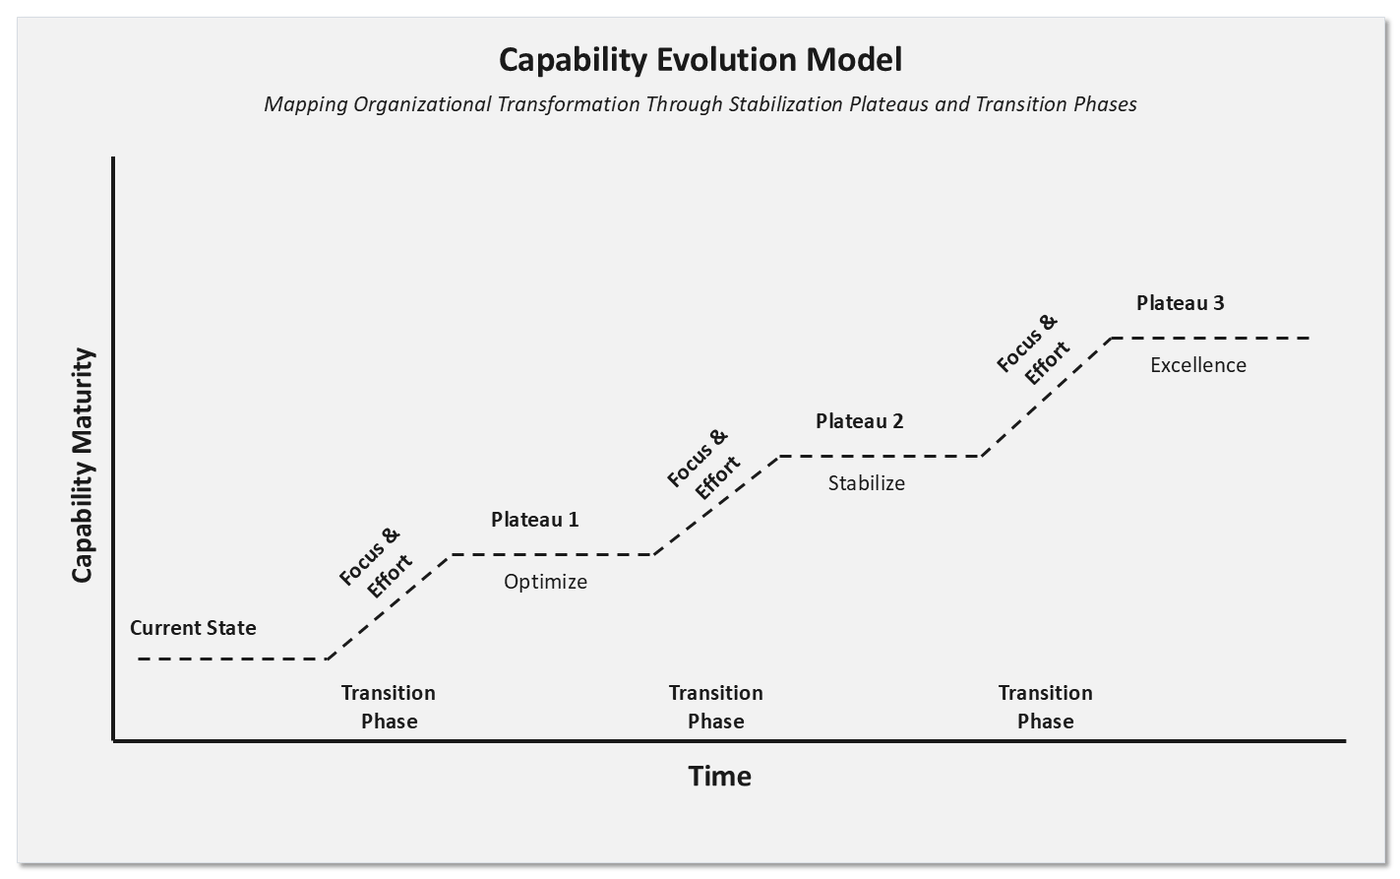
Capability evolution
Plan the maturity path for each critical capability across the plateaus, with the lead time each step needs. Where internal build is not feasible, name the external support and the knowledge transfer mechanism that ends it.
Capacity and sequencing
By function
Which departments carry the greatest change burden, and which are underused and can absorb work.
By capability
Which skills are scarcest across the portfolio, driving hiring, training and partner decisions.
By timeline
When the crunches land, at quarter ends, seasonal peaks and regulatory deadlines, and what moves around them.
Red zone mitigations: redistribute work to less constrained periods, augment with partners or contractors, redesign the initiative to need fewer scarce people, or build the capability ahead of need.
What makes a plateau viable
Four tests, applied to every plateau before it is put on the roadmap.
Delivers defined business value
Actual benefit that justifies the investment to reach it, not a technical milestone.
Operationally stable
Complete processes, clear accountabilities, functioning systems. Could be held indefinitely.
Builds toward the target
The next step adds and enhances rather than replaces and rebuilds. No temporary work to be undone.
Produces learning
Captured lessons that change the design and execution of the plateaus that follow.
Each plateau documents entry criteria, stable-operation requirements, exit criteria, and a rollback plan for temporary retreat.
The roadmap’s four views
| View | What it shows | Owned by |
|---|---|---|
| Timeline | Phases, milestones, overlaps, and the sequences that cannot be violated. | Project management |
| Dimension | Parallel streams across the six dimensions, so none races ahead or is left behind. | Architecture |
| Value | Cumulative benefit against business case, showing whether the programme remains viable. | Finance |
| Resource | People and budget across time, surfacing conflicts before they hit delivery. | Resource management |
Plus a critical path identified and protected with dedicated resources, and time, resource, scope and financial buffers built in explicitly.
Programme shape: four plateaus over 24 months
Foundation and quick wins
Unified core data, visible customer-facing improvements, cost reduction that funds the rest.
Core transformation
New structures take effect, core processes are redesigned, critical platforms deploy.
Optimization and scaling
Deployments refined on operational learning, and successful patterns replicated with local fit.
Evolution and excellence
Continuous improvement runs without external support, and evolution capability is owned internally.
Engine, compass, rudder.
Three pieces run the programme. The transformation management office drives, the scorecard shows the course, and tiered governance bodies make the corrections the engine cannot make alone.
Transformation management office
Drives daily execution and coordination across the portfolio. Unlike a traditional PMO it actively drives rather than tracks and reports.
Balanced transformation scorecard
Shows whether the programme is on course or drifting, across execution, value, adoption and health.
Tiered governance bodies
Make the decisions and course corrections the engine cannot make alone, on the evidence the compass provides.
TMO core roles: transformation director, workstream leads, integration lead, change lead. Enabling functions: planning and control, risk and issue management, benefits tracking, communications. The PMO backbone provides administrative consistency without bureaucratic burden.
Accountability baseline
| Role | Owns | Decides |
|---|---|---|
| Executive sponsor | Strategic intent, air cover, gate decisions. | Plateau transitions, scope above threshold. |
| Transformation director | Programme leadership, stakeholder management, momentum. | Sequencing within an approved plateau. |
| Workstream leads | Delivery within one dimension or programme area. | Design detail inside their dimension. |
| Integration lead | Cross-dimensional dependencies and conflicts. | Interface contracts between workstreams. |
| Change lead | Adoption, engagement, behavioural change. | Communication and enablement approach. |
| Benefit owners | Realization of a named benefit in operations. | Baseline definition and recovery actions. |
| Operating model council | Permanent stewardship after the programme closes. | Evolution portfolio and principle exceptions. |
Operating rhythm
| Cadence | Forum | Purpose and output |
|---|---|---|
| Daily | Workstream stand-up | Progress, plan and impediments needing help. Brevity and action, not discussion. |
| Weekly | Integration meeting | Cross-workstream dependencies resolved before they hit delivery. |
| Monthly | Steering committee | Scorecard review and decisions on scope, resources and timeline. Pre-reads 48 hours ahead. |
| Quarterly | Transformation board | Strategic alignment, value validation, continued investment and air cover. |
| At plateau end | Plateau gate review | Exit criteria evidenced, benefits confirmed, next plateau authorized. |
The transformation scorecard
Green needs no intervention. Yellow triggers monitoring and mitigation. Red demands intervention and possible replanning.
Project execution
Milestone achievement against plan, budget burn and variance, resource utilization, issue resolution time and backlog, scope change frequency, deliverable quality.
Business value
Cost reduction and revenue against target, customer satisfaction movement, cycle time and productivity, error rates and first-contact resolution, competitive position.
Adoption and change
Engagement by stakeholder group, training completion and competency, system usage and process compliance, resistance levels, champion activation, observed behaviour change.
Risk and health
Dependency risk status, technical debt trend, organizational capacity and fatigue, partner performance, knowledge transfer completeness, benefits erosion.
Tiered governance
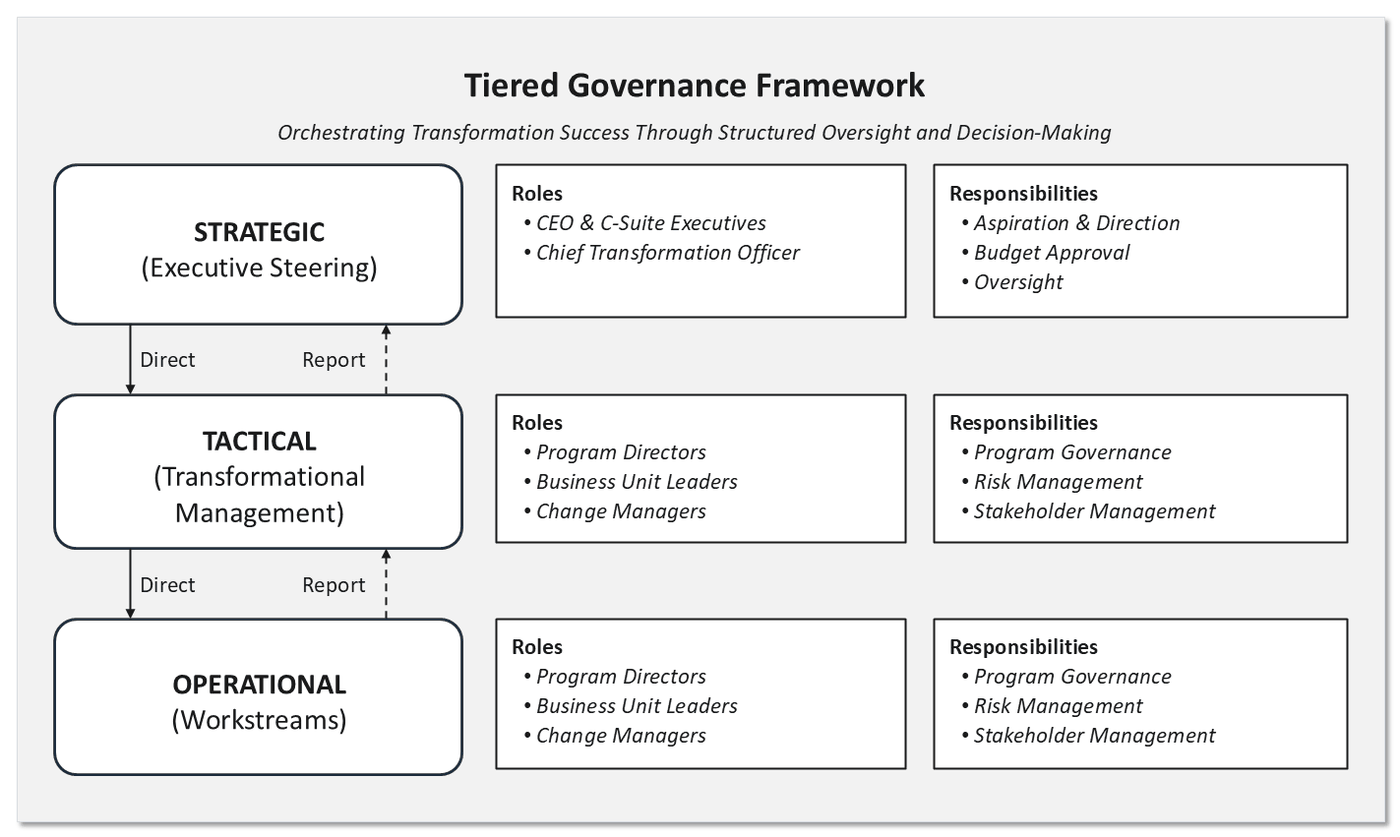
Steering committee decision rights: plateau transitions, scope above threshold, resource conflicts between change and operations, stakeholder conflicts, risk acceptance. Workstream governance resolves what it can and escalates what it cannot, on defined triggers rather than on discomfort.
Benefits with owners, and value inside 90 days.
A benefit with no named owner in operations is a line in a business case. The matrix below is what turns it into something measured.
| Column | What it records, and the discipline behind it |
|---|---|
| Type | Cost reduction, revenue enhancement, risk mitigation or strategic positioning, each measured differently. |
| Owner | The leader accountable for realization in operations, with authority to influence it. |
| Baseline | Documented before change begins, agreed by stakeholders, archived to prevent retroactive adjustment. |
| Target | Cascaded from the business case, ambitious enough to justify investment and credible enough to defend. |
| Milestones | Monthly or quarterly checkpoints that trigger variance analysis early rather than annually. |
| Actual and variance | Measured continuously from operational data, with automated collection wherever possible. |
| Action | Root cause, recovery plan with owner and date, or restructure and terminate if the benefit is unachievable. |
The 90-day value sprint
Dedicated team, mixed skills, decision authority, executive sponsorship. Daily standups, weekly demonstrations, fortnightly retrospectives.
Process
Remove duplicate data entry, automate manual reconciliation, strip unnecessary approval steps, consolidate reports and meetings.
Procurement
Consolidate vendors, renegotiate on combined scale, cancel unused licences, optimize cloud consumption.
Customer
Self-service for common transactions, better call routing, first-contact resolution, faster onboarding.
Data
Consolidated executive dashboards, automated standard reports, cleaned customer data, self-service analytics.
Clarity
Decision rights clarified, overlapping responsibilities consolidated, escalation paths and new metrics defined.
Demonstrate the value deliberately: before-and-after comparisons, real-time dashboards, customer communications, and documented evidence that secures the next tranche of funding.
Execution pitfalls and recovery plays
| Pitfall | Warning signs | Recovery play |
|---|---|---|
| Scope creep | Constant “small” additions, pet projects entering scope, original objectives obscured. | Freeze additions, prune against core value, re-baseline, communicate clearly. |
| Resource drainage | Missed meetings, operational fires winning, “temporary” reassignments, burnout on double duty. | Return resources, backfill operations temporarily, reset timeline, ring-fence going forward. |
| Integration failure | Workstreams isolated, technical solutions not matching process design, late discovery of incompatibility. | Stop affected streams, assess impact across dimensions, redesign at root cause, strengthen integration governance. |
| Stakeholder fatigue | Falling participation, rising resistance, turnover in key areas, productivity below baseline. | Reduce change intensity, stabilize before progressing, celebrate achieved wins, extend timeline if needed. |
| Benefits erosion | Improvements degrading, old behaviours returning, savings consumed by new spend, irregular reporting. | Measure current against expected, find root cause, hardwire controls into operations, restore accountability. |
Plateau transition.
This gate repeats at every plateau rather than once at the end of the stage.
Entry criteria
Roadmap approved with four views. Benefit owners named with archived baselines. TMO staffed and resources ring-fenced. Scorecard live with thresholds calibrated.
Exit criteria
Plateau exit criteria evidenced. Critical incident rate under 1% monthly. Core processes meeting service levels at least 90% of the time. Benefits for this plateau measured against baseline, not asserted. Rollback plan for the next plateau tested.
Deliverables
Integrated roadmap. Value-complexity canvas and prioritized portfolio. Benefits realization matrix with actuals. Scorecard pack. Sprint evidence pack. Retrospective and lessons for the next plateau.
Reflection questions
Answer these before the roadmap is locked. Where transformations fall short, the cause usually sits in execution choices made in the first six weeks.
- What should drive sequencing: quick wins, foundational capability, or customer visibility?
- How would explicit transition plateaus change your exposure to transformation risk?
- What would capability-centred workstreams look like against your current project structure?
- What different authorities would your TMO need to coordinate continuous evolution?
- Where should implementation governance enable speed rather than ensure control?
Build the capability to keep changing.
Stage 6 runs continuously from go-live, with a first review at 90 days. This is the stage organizations skip, and skipping it is what turns a successful implementation into an expensive one.
Purpose
Build the capability to keep changing, so the model adapts instead of aging.
Inputs
A stable implementation, measured baselines, live principles, and the learning captured during delivery.
Activities
Four AVAL disciplines run in parallel: adoption, value, adaptation and learning, on a defined council rhythm.
Outputs
AVAL dashboard, adoption maps, evolution backlog, learning library, council charter.
Entry check
Run this before stage six starts. Evolution built on an unstable implementation, drifting principles or a missing baseline measures nothing. All three checks green before the evolution mandate is signed, and amber only with a dated remediation owner.
Implementation complete
System stability: incident rate at or below the pre-go-live baseline for 60 consecutive days. Process performance: four of six core processes at or above design throughput. TMO transitioning from a build mandate to an evolution mandate, and not yet disbanded.
Design principle alignment
Score recent decisions against each principle tier. Any tier below 70% means recent decisions are drifting from the principles. Re-test the decisions, not the principles.
Baseline metrics
The four scorecard quadrants evolution will be measured against, each with a now figure, a target and the gap between: financial cost to serve, customer net promoter, process cycle time, people engagement. Fix the baseline before go-live, never after.
Three dangers after go-live
Adoption gap
People comply without embracing. Mandatory training completed, behaviour unchanged, systems used only for required tasks while discretionary work continues in the old pattern. Usually caused by incentives that still reward the old behaviour. Usage logs can read 100% while capability utilization sits below 20%.
Value leakage
Benefits fail to materialize despite a successful technical implementation, drained by a thousand small compromises each reasonable in isolation. A manual approval added for comfort. A review step for assurance. A parallel process just in case. A shadow system for backup.
Evolution debt, again
The new model is treated as a fixed structure rather than a living system, and freezes at the point of implementation while the market keeps moving. This is the failure the whole framework exists to prevent, recurring on the other side of go-live.
Early warning indicators
Quantitative
Cycle times creeping above baseline, 5% then 10% then 20%. Exception rates rising until the exceptional is routine. System response times degrading. Customer effort scores increasing on simple tasks.
Behavioural
Shadow IT proliferating. Informal how-to guides spreading that teach workarounds rather than the process. Meeting proliferation, with alignment sessions filling calendars the model was supposed to free.
Strategic
Market response time lengthening. Strategic initiatives losing ambition between announcement and delivery. High performers leaving for more agile competitors, and candidates sensing rigidity at interview.
Integrate the signals into an evolution pressure score out of 100: external threat contributes up to 40 points, internal performance gaps up to 30, employee feedback themes up to 30. Above 60 triggers deep analysis; above 80 triggers the rapid response protocol.
The AVAL framework
Adoption
Move from compliance to commitment by making the new way genuinely better than the old one.
Value
Convert promised benefits into measured value, with a named owner for each and active recovery when they slip.
Adaptation
Sense, analyze, design, implement, on a rhythm, so change is routine rather than a crisis response.
Learning
Capture lessons in a form that changes the next decision, and measure how often they actually do.
Treated as separate workstreams, the four decay. Treated as one system, they compound.
The four metrics that matter
| Metric | What it measures | Expected trajectory |
|---|---|---|
| Adoption depth score | Behavioural change on a 0 to 100 scale: capability utilization (40%), process adherence (30%), behavioural indicators (30%). | 35 to 45 at start, 65 to 75 by six months, 80 to 85 at maturity. |
| Value realization index | Benefit delivery against the approved business case, weighted for early delivery and penalized for delay. | 40 to 50 at six months, 70 to 80 at twelve, above 100 at eighteen. |
| Adaptation velocity | Elapsed days from a formally recognized change need to a change that is operational and delivering value. | 30 to 45 days modular, 60 to 90 cross-functional, 120 to 180 architectural. |
| Learning application rate | Share of relevant captured lessons that actually influence a decision when the applicable situation arises. | Rising share over time. A flat rate means lessons are captured but never used. |
Adoption: from compliance to commitment.
The gap between what people say and what they do is the point of the exercise. Each quadrant of the adoption picture takes a different intervention, and detached compliance is the quietest risk because the behaviour looks fine while the commitment is absent.
WorksheetStakeholder adoption quadrantAttitude against behaviour
Champions
Positive attitude, high adoption. The mechanism behind their success is what you scale, not the message.
Enthusiasts
Positive attitude, capability gaps. They want the new way and cannot yet run it. This is a training and design problem, not a motivation problem.
Detached
Negative attitude, compliant behaviour. The quietest risk, because usage looks correct while commitment is absent.
Resistors
Negative attitude, low adoption. Active resistors carry information the programme needs, so treat the objection as data first.
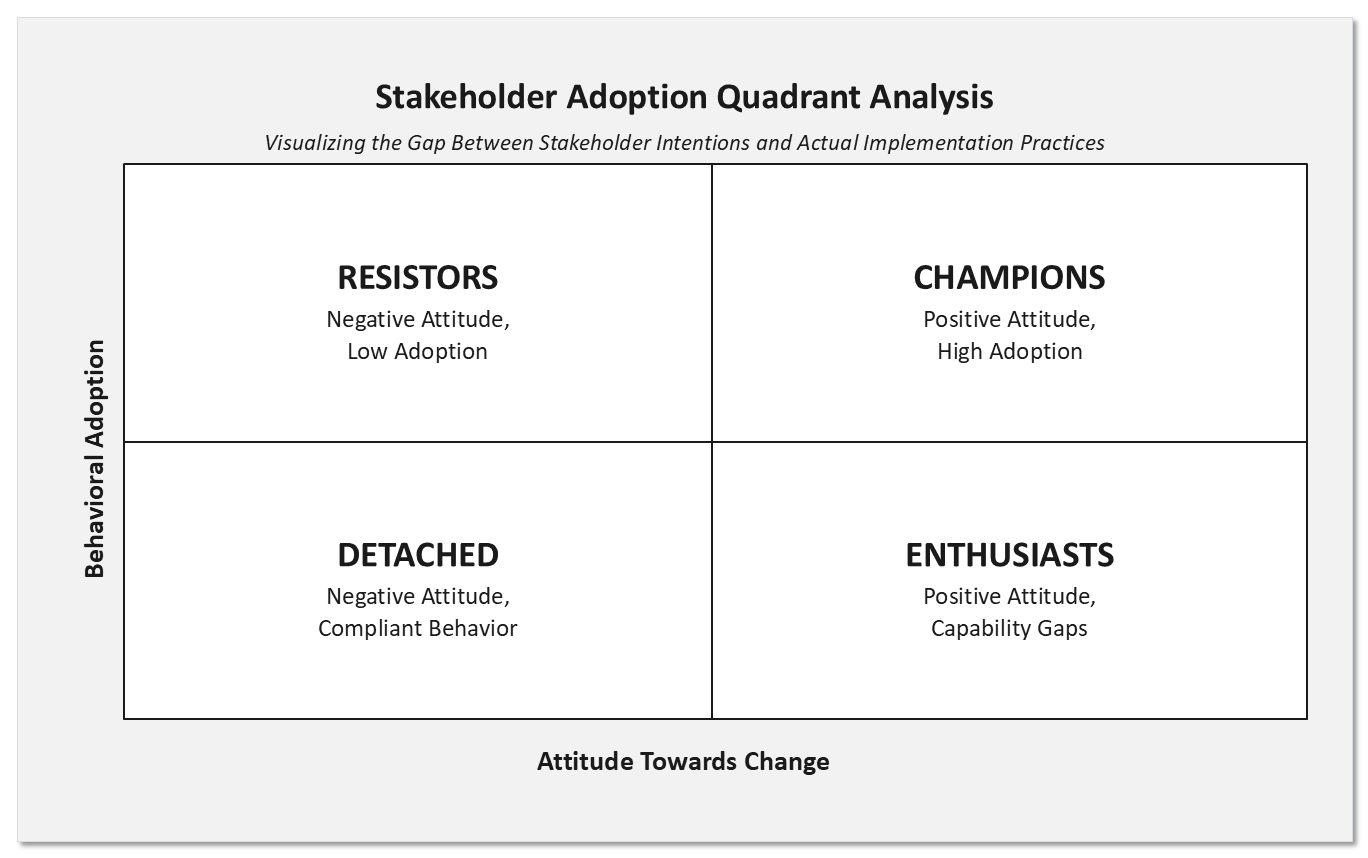
ToolDifferentiated adoption journey mapOne path per stakeholder group
Design a distinct path per stakeholder group: what they need to know, what they need to be able to do, and what would make the new way better for them specifically. Each group moves through awareness, understanding and adoption, and each meets a different barrier on the way.
| Barrier | Intervention | Outcome |
|---|---|---|
| Capability gaps | Capability building through targeted training programmes. | Confident execution and skilled implementation. |
| Shadow processes | Process alignment that eliminates parallel systems and workarounds. | True process adherence and genuine commitment. |
| Control concerns | Co-creation opportunities and collaborative design. | Ownership, buy-in and expert endorsement. |
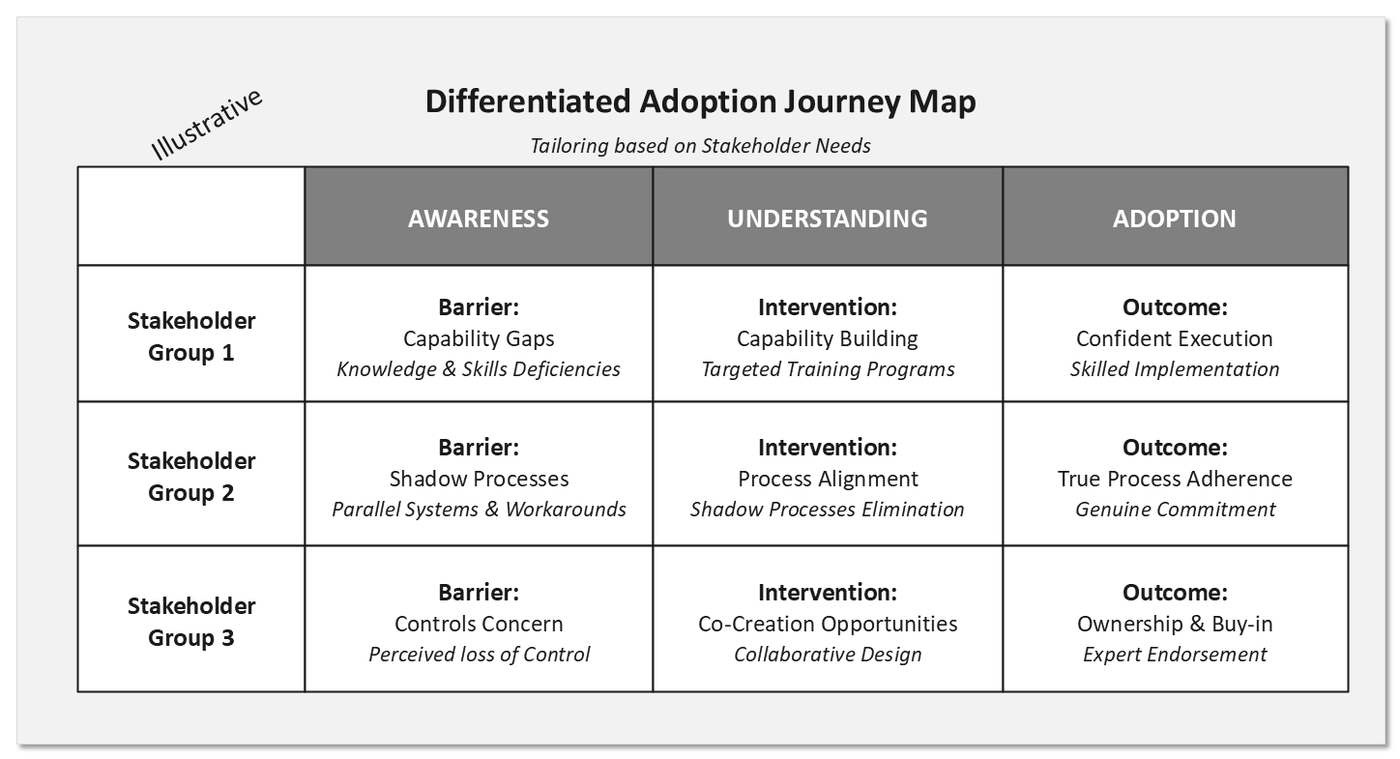
Align incentives before asking for behaviour. Adoption stays superficial while performance metrics still reward the old way of working.
DiagnosticAdoption health dashboardFour panels, one screen
Depth, not activity: what is being used, by whom, who needs help and what is worth scaling.
Adoption depth by division
Adoption depth score per division with a 30-day trend, so a falling division is visible before it becomes a recovery project.
Feature utilization
Utilization per capability over six months, left to right. Red is ignored, green is embraced.
Support needs indicator
Flag any team on two or more of: help-desk tickets above baseline, error rates rising, cycle times not improving. Intervention is coaching and design fixes, not more training. A flag is a design signal first.
Success pattern analysis
Where adoption is deep, find out why, then scale the mechanism rather than the message. Test the pattern in one low-adoption division before rolling it everywhere.
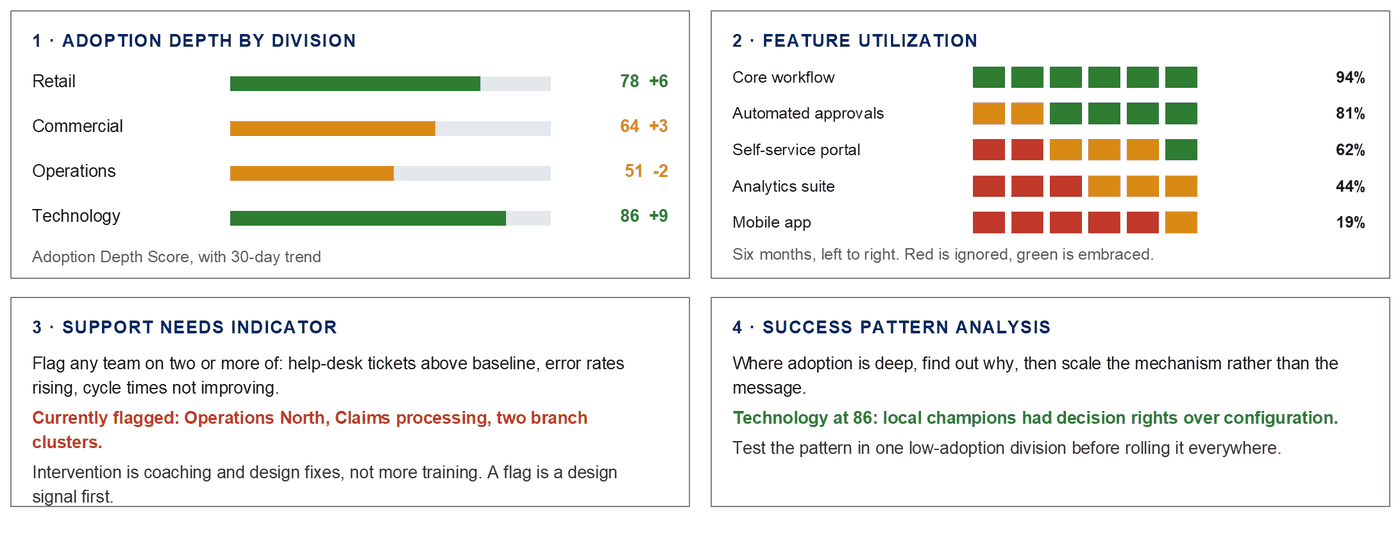
Value: owned by a name, not by a business case.
Every benefit gets a single executive owner with the authority to influence realization and accountability for the result. Ownership survives the programme, because benefit owners remain accountable after implementation closes, which is precisely when erosion starts.
ToolBenefits ownership matrixOne owner per benefit category
| Category | Executive owner | Measurement approach |
|---|---|---|
| Strategic | CEO and executive leadership | Market share analysis, competitive benchmarking, strategic capability index. Covers competitive positioning and market adaptability. |
| Financial | CFO and financial leadership | Quarterly financial review, profit and loss impact analysis, cost-benefit ratio. Covers cost reduction and revenue growth. |
| Customer | CCO and customer experience | Net promoter and satisfaction metrics, customer journey analysis, retention rate. Covers experience quality and service improvement. |
| Operational | COO and operational leadership | Cycle time analysis, service level adherence, error rate tracking. Covers process efficiency and quality improvement. |
| Enabling | CIO and technology leadership | Platform adoption rate, digital capability score, digital maturity assessment. Covers technology platform and digital capabilities. |
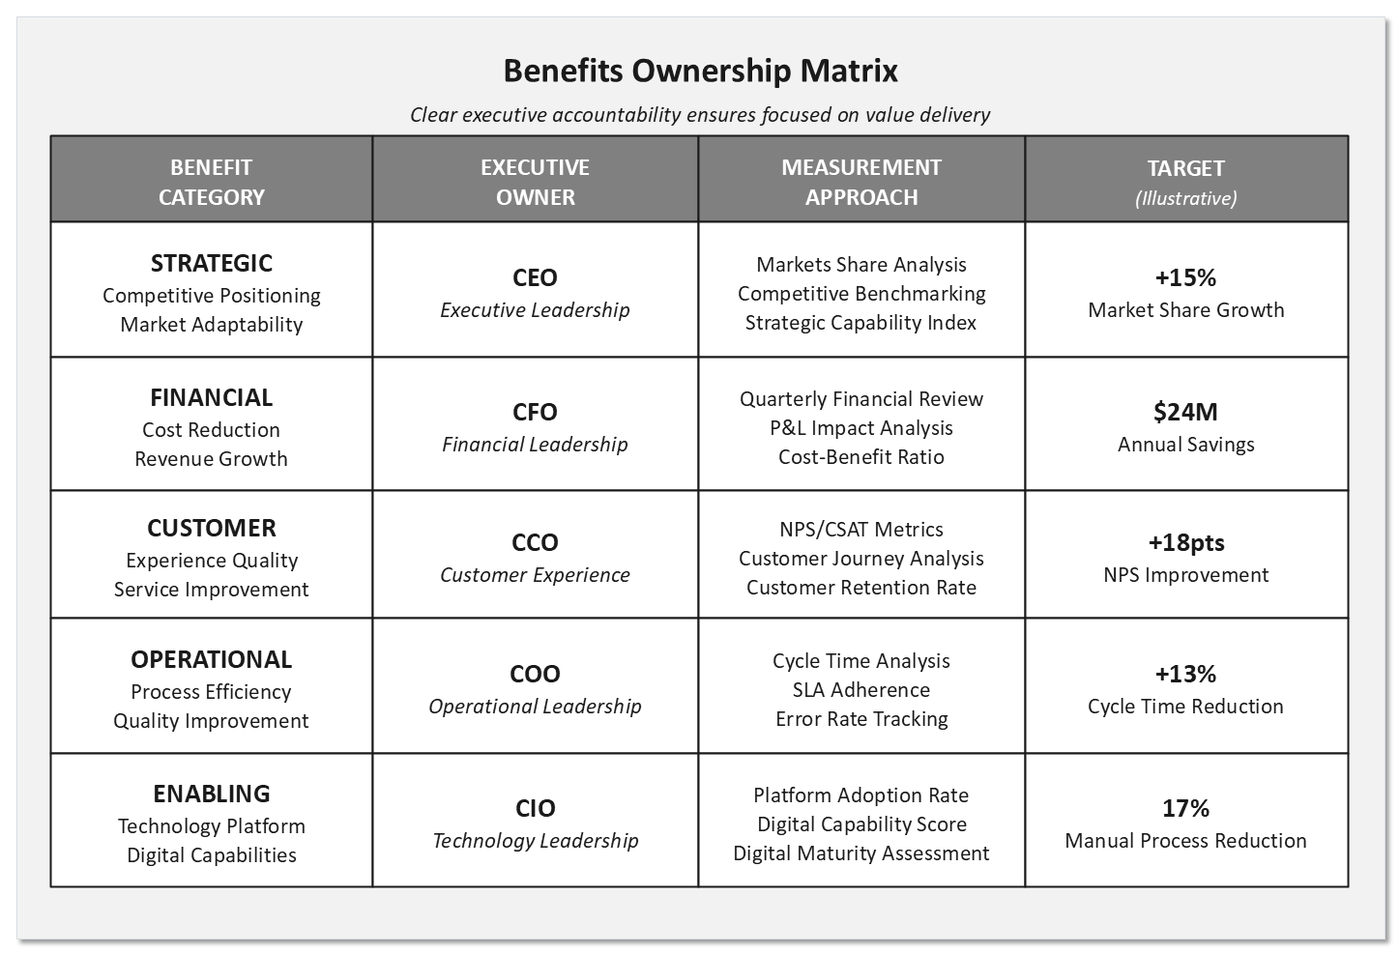
DiagnosticBenefit dependency networkWhy a benefit is stuck
A benefit is not a line in a business case; it is the output of a set of capabilities. Map the dependencies and the reason a benefit is stuck stops being a mystery.
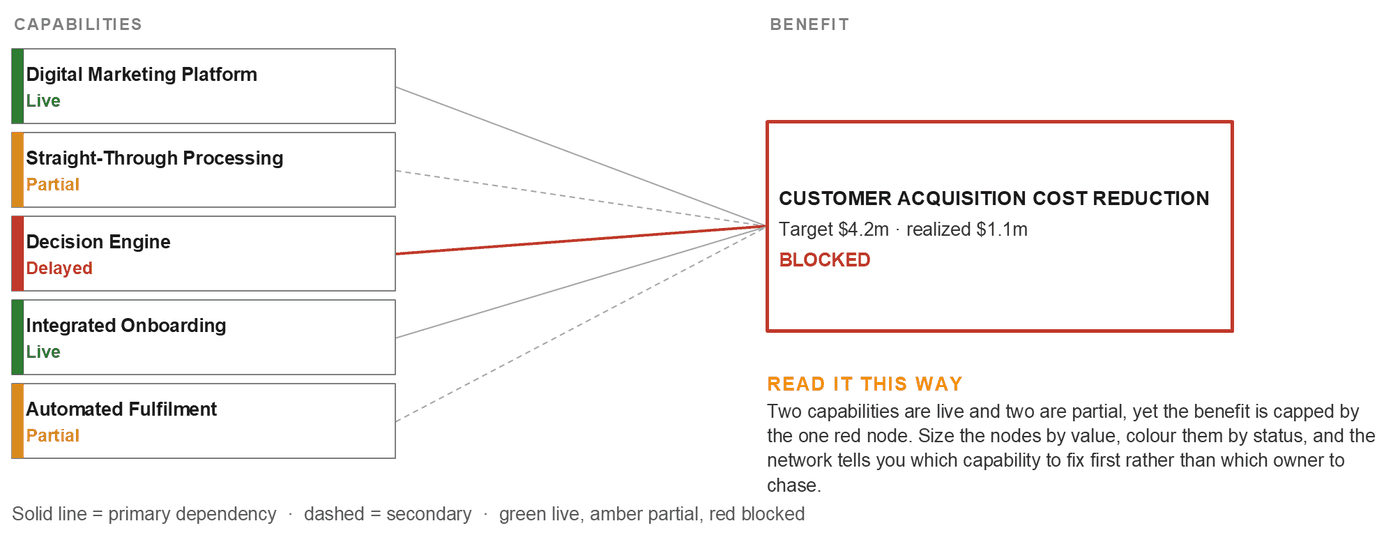
Read it this way: two capabilities are live and two are partial, yet the benefit is capped by the one red node. Size the nodes by value, colour them by status, and the network tells you which capability to fix first rather than which owner to chase.
ToolActive value management processTrack, diagnose, intervene, scale
A continuous cycle: track progress against baseline, diagnose the gap, implement the correction, then scale what worked to comparable areas.
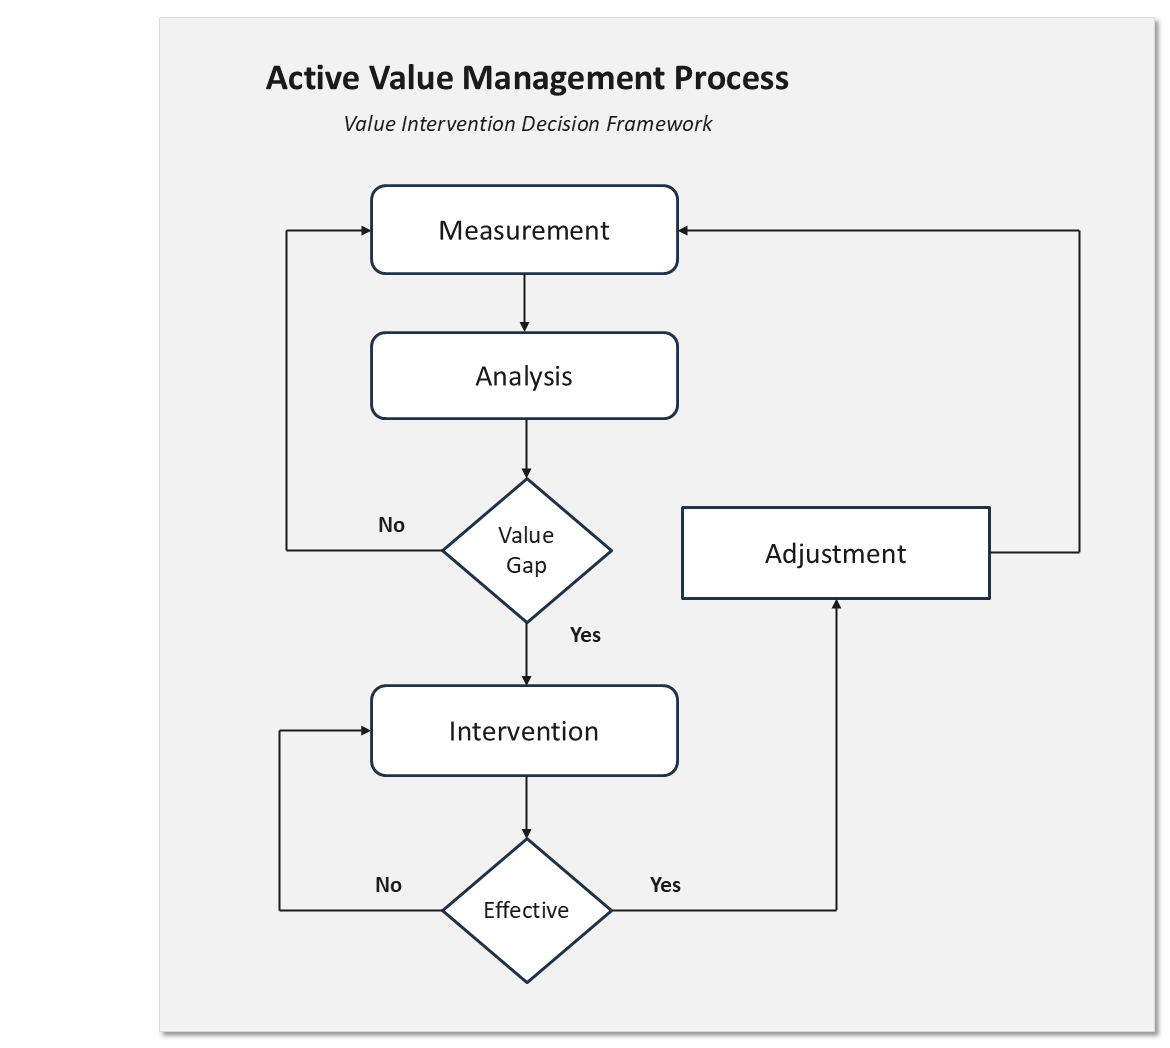
Hardwire protection into operations through system constraints, process controls, metrics and governance, so improvements cannot quietly decay.
Adaptation on a rhythm, learning that changes a decision.
Adaptation runs as a cycle with fixed cadences rather than as a response to crisis. Learning is judged by how often a captured lesson reaches the room where the comparable decision is taken.
Monitor
Environmental sensing, internal performance, and employee feedback channels with committed response times.
Analyze
Pattern recognition, impact assessment in money, and root cause analysis.
Design
Solution development and change planning against the design principles.
Implement
Execution with change management, then results feed monitoring.
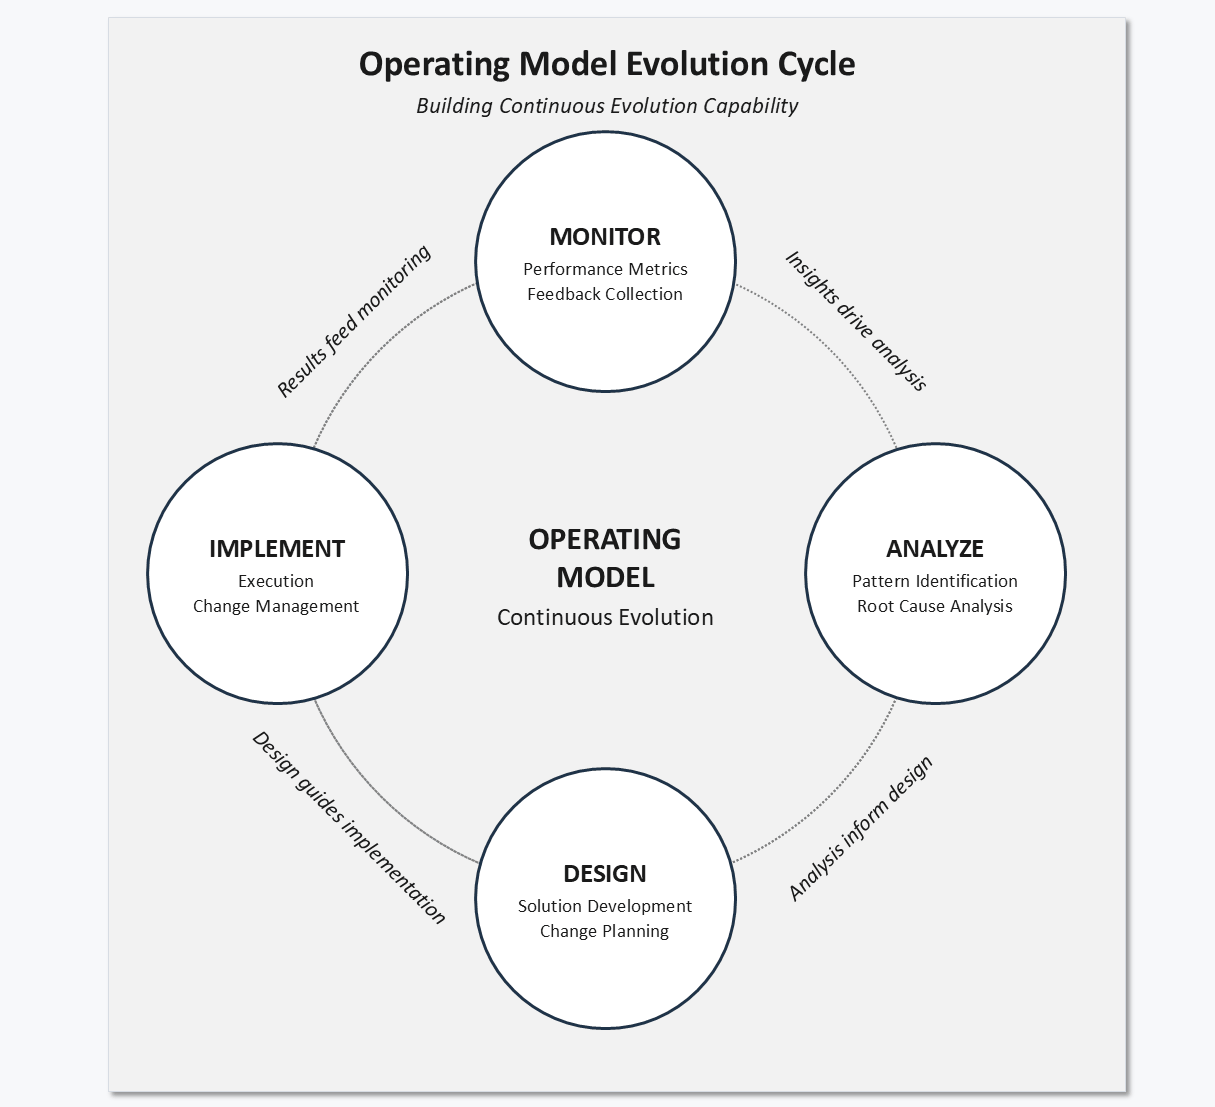
Multi-level adaptation
Distributed decisions with coordinated boundaries: local teams adapt inside their domain, cross-functional bodies handle coordination, and the council owns architectural change. Each level provides constraints and context for the level below while respecting authority boundaries.
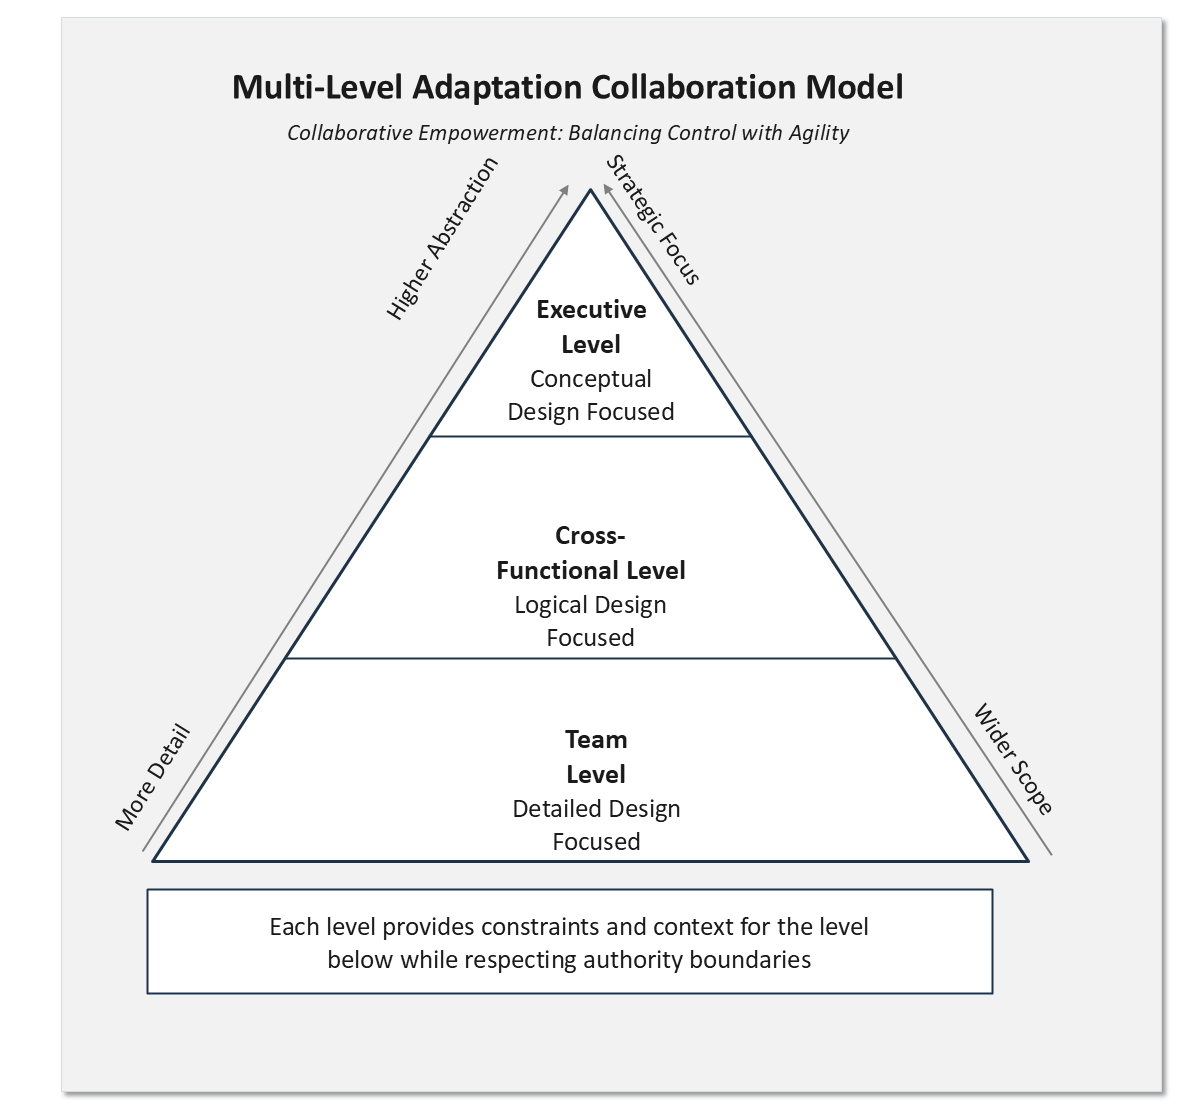
Keep a rapid response capability for evolution pressure above 80: a standing team, pre-agreed authority, and a defined clock.
The learning library
Design rationale
Not just what was built but why it was chosen, and what was rejected. This is what prevents relitigation two years later.
Playbooks
Reusable methods for common change types, with templates, governance route, success patterns and known failure modes.
Decision log
Every significant decision, its owner, its evidence and its outcome, so institutional memory survives turnover.
Retrieval at decision
Lessons surfaced into the forum where the comparable decision is taken. Measured by learning application rate, not by library size.
Knowledge transfer protocol for the end of the programme: paired working on critical activities, gradual handoff, competency assessment, coaching during transition, and explicit exit criteria for external support.
Seven ways evolution dies after go-live
Each pattern recurs after go-live, and each has an observable signal, so each can be caught early.
| Pitfall | Recognition signal | Prevention |
|---|---|---|
| Mission accomplished | TMO disbanded within 30 days, sponsors move to the next initiative, governance forums quietly cancelled. | Position go-live as phase 1 of 3. Hold governance 12 months, rotate the team gradually, target 40% of benefits by month 6, 70% by 12, 100% by 18. |
| Perfection paralysis | Value deferred until full adoption, success criteria keep expanding, minor non-compliance triggers major intervention. | 70% adoption triggers the shift to value, and 80% counts as full success. Design for the willing majority; 100% is not a real target. |
| Speed over learning | No retrospectives run, the same mistake reappears in the next wave, lessons live in people’s heads. | Make learning capture a gate condition. Nothing closes until the rationale and the lesson are in the learning library. |
| Implementation equals success | Success declared because the systems work and the org chart changed. | Define success as adoption level, benefit realization and adaptation capability. Track outcomes, not structural completion. |
| Fragmented responsibility | HR owns adoption, Finance owns benefits, Strategy owns adaptation: three disconnected plans. | One integrated forum for the whole post-implementation phase. One team, one accountability, one outcome. |
| Generic change management | One change programme applied identically to engineers and to salespeople. | Analyze stakeholder impact in detail, then build a targeted strategy per group. Head office tactics fail in the field. |
| Passive benefit tracking | Variance is reported but never closed; benefits are watched rather than managed. | Active value management: track against baseline, diagnose, intervene, re-forecast. A named owner with authority per benefit. |
Evolution capability established.
Entry criteria
Final plateau exit criteria met. Post-implementation baselines captured across all four scorecard quadrants. Operating model council constituted with cross-functional senior membership.
Exit criteria
All four AVAL metrics live with published trajectories. Evolution cycle running on cadence with a real backlog. Sensing mechanisms operating with named accountability per domain. Knowledge transfer complete and external support exited. Council rhythm in the corporate calendar.
Deliverables
AVAL dashboard. Adoption quadrant and journey maps. Benefits ownership matrix with post-programme owners. Evolution backlog. Learning library with playbooks. Council charter and calendar.
Reflection questions
Answer these once the model is live. They test whether you have implemented an operating model or built an adaptive enterprise, and the difference shows up in the second year rather than the first.
- What adoption barriers face each stakeholder group that generic change management misses?
- How would active value management change your return against passive benefit tracking?
- What mechanisms enable operating model evolution today, and what is still missing?
- Do adoption, value realization and adaptation reinforce each other here? If not, why?
- What would building evolution capability as a core competency actually require of you?
Narrative first, because the curve is emotional.
Four leadership disciplines run across every stage and decide whether the design is adopted or endured: narrative, mobilization, communication and resistance.
Every transformation follows the same emotional arc, and groups sit at different points on it simultaneously. Technology may be exploring while operations still resists. Choose the intervention per group, not per programme. Commitment is what the adoption depth score actually measures.
Denial
“This won’t really change how we work.” Intervene by creating urgency with data and stories.
Resistance
“This will never work here.” Intervene by listening and addressing the root concern.
Exploration
“Maybe there’s something worth trying.” Intervene by providing safe spaces to experiment.
Commitment
“This is how we work now.” Intervene by celebrating and institutionalizing wins.
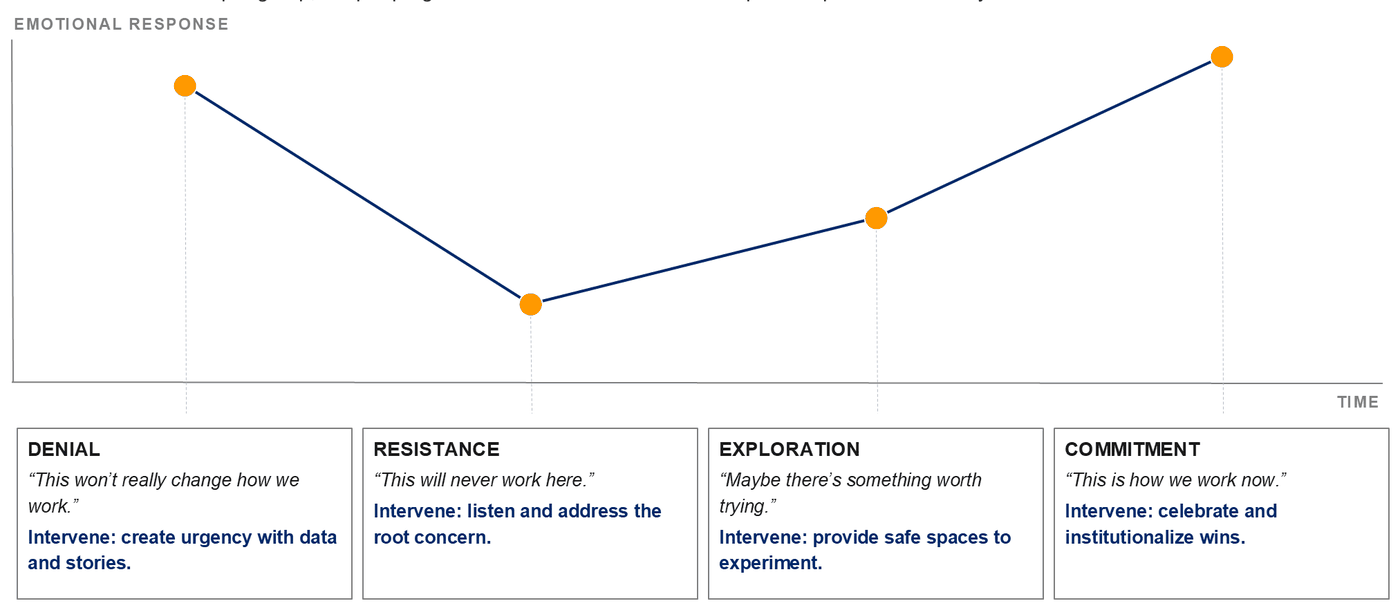
WorksheetChange narrative canvasFour quadrants
Four quadrants that turn a transformation into a story people can locate themselves in. This is not communication planning: it is meaning-making, and it draws directly on the purpose and aspiration ratified at the Establish North Star gate.
Respected past
What achievements define us? What brought us here that must not be dismissed as outdated? Honour it explicitly, or people hear that their life’s work is being discarded.
Urgent turning point
What external force demands change, and why does standing still mean falling behind now? External threats resonate. Internal inefficiency does not.
Aspirational future
What specific outcome will we achieve that is worth the difficulty of the change? Concrete and imaginable, not “excellence” or “market leadership”.
Our role in getting there
How does each person contribute? What does each function become in the new model? People must see themselves enhanced, not replaced. Name the new role, not the new process.
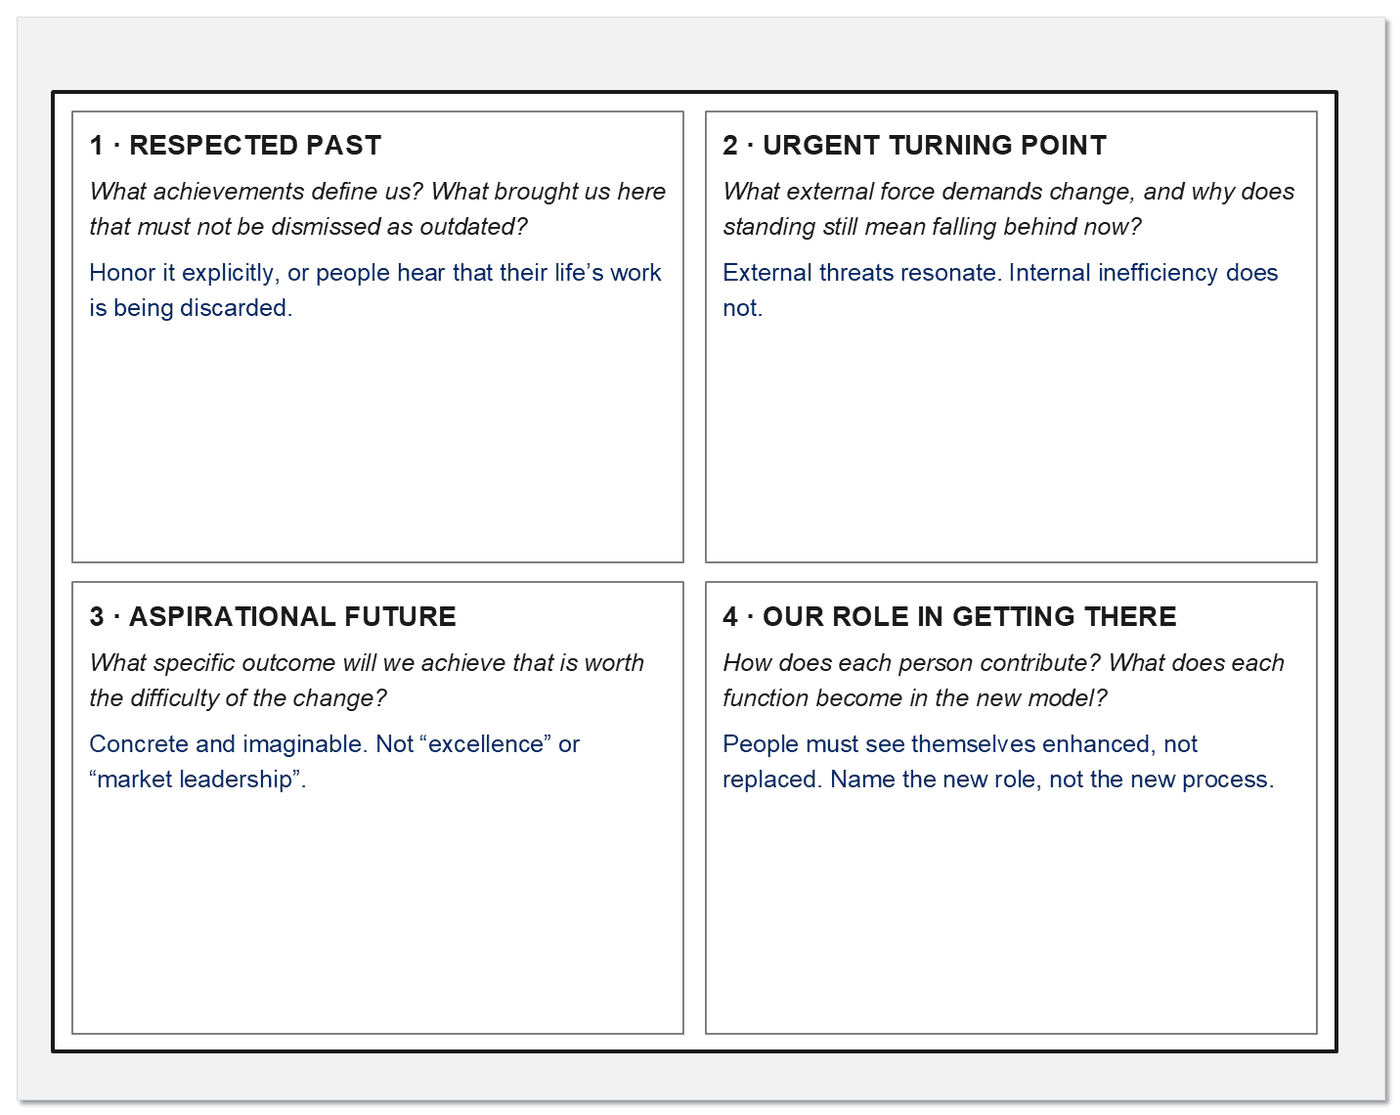
Map influence, translate the message, treat resistance as data.
Three disciplines follow the narrative. Each has a tool, and each fails in a predictable way when it is run as a broadcast rather than a loop.
Discipline 2 · MobilizeStakeholder influence and impact matrixTwo axes, four plays
Influence is formal authority plus informal credibility, expertise and network reach. Impact is how much the transformation changes someone’s role, tools, relationships and day. Change travels through networks of influence that exist regardless of the org chart, so map both axes before mobilizing anyone.
Influencers · high influence, low impact
Convert them to champions. They shape opinion while barely changing themselves. Ambassador programmes with real status, sentiment pulse checks, speaking slots, first look at anything affecting their networks.
Key players · high influence, high impact
Make them co-creators. They can make or break it and are heavily affected. Co-creation workshops, an advisory council with real decision rights, early access to tools and training, a direct line to the executive sponsor.
Monitors · low influence, low impact
Keep them informed. Standing updates through existing channels. No bespoke engagement, but a named escalation route for the moment their impact changes.
Affected groups · low influence, high impact
Give them voice. Front line, junior analysts and service teams carry the burden without the power to shape it. User-experience councils with design input, pilot participation, anonymous channels with visible responses.
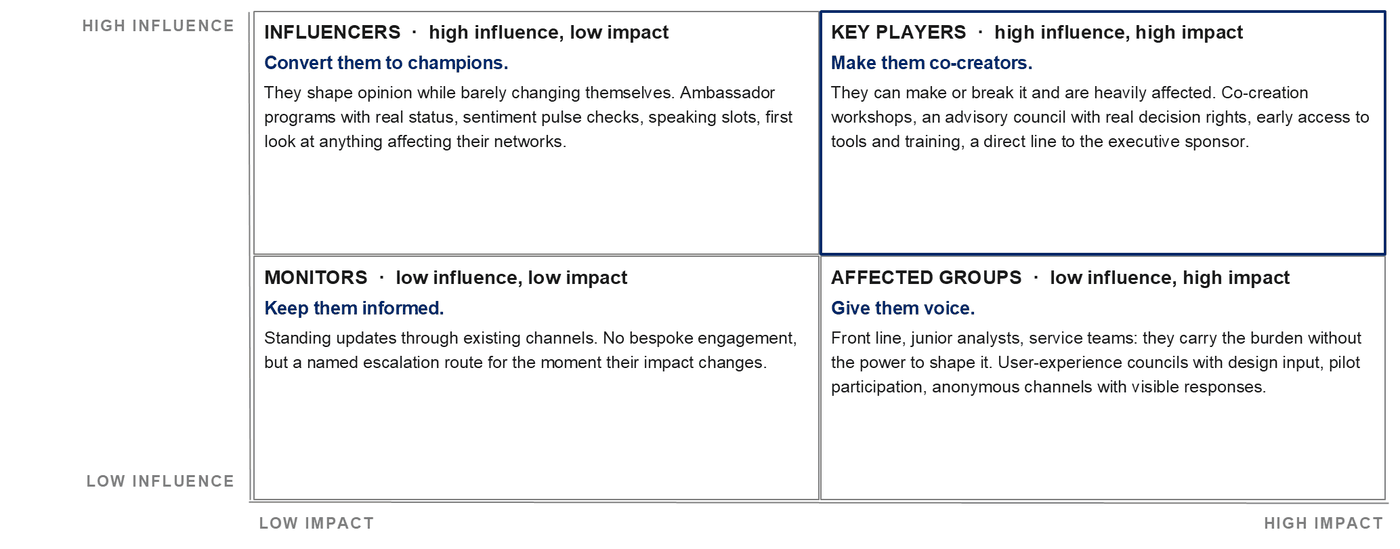
Discipline 3 · CommunicateTransformation communication architectureThree layers, one loop
Most transformations drown in communication that informs without engaging. The message has to be translated at each layer and the loop has to run back up, or leadership hears only what it broadcast. Every layer is also a listening post.
Leadership layer
Vision, strategy, the case for change. Why we are changing and what it is worth.
Functional layer
Translation by function leads. What this specifically means for us.
Team layer
Implementation at the front line. What we do differently on Monday.
| Dimension | What the plan specifies per segment |
|---|---|
| Audience | Be specific. “Senior engineers in product development”, not “technical staff”. |
| Message | What they need to know and why they should care. |
| Messenger | Credibility beats hierarchy. Peers for culture, experts for technical, customers for market, leaders for strategy. |
| Channel | Match medium to complexity. Complex change needs dialogue, not a webinar. |
| Frequency | Daily in transition, weekly in active change, monthly in stabilization, quarterly for context. |
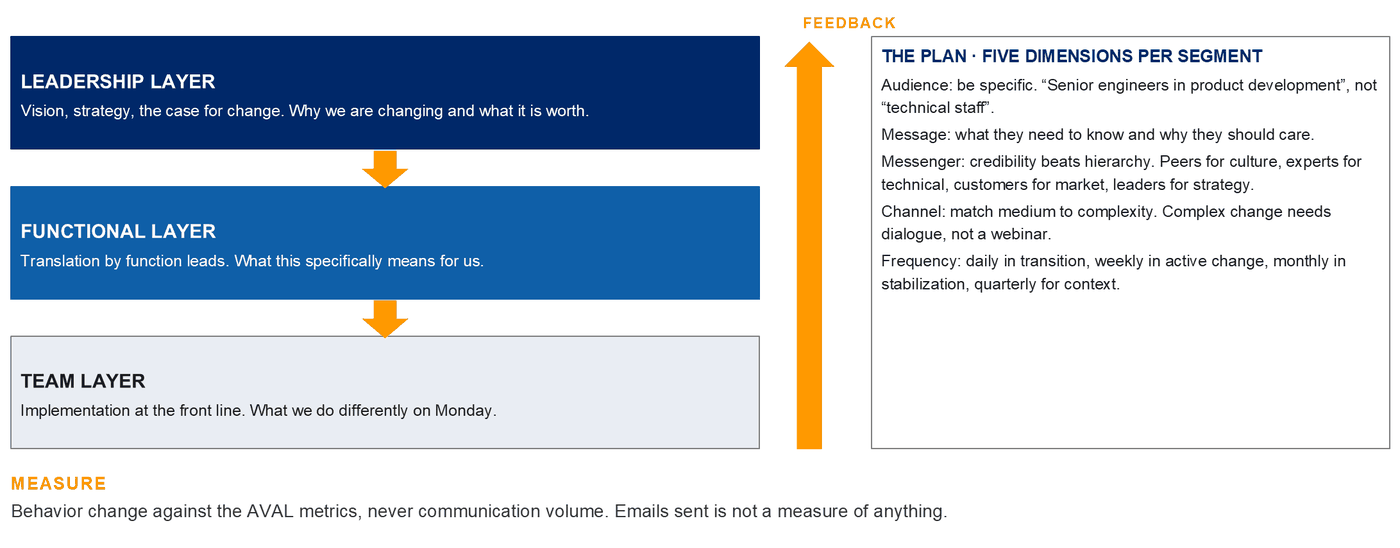
Measure behaviour change against the AVAL metrics, never communication volume. Emails sent is not a measure of anything.
Discipline 4 · ResistanceResistance resolution frameworkA four-step cycle, run twice
Resistance is information, not obstruction. It reveals what people value, what they fear losing and what they need in order to move. Suppress it and you lose the feedback; engage it and you get a better design and deeper commitment.
Surface and listen
Anonymous surveys for patterns, focus groups for depth, skip-level conversations for the unfiltered version. Listen for the need beneath the position: “too complex” often means “I am afraid of looking incompetent”.
Acknowledge and validate
Public recognition that the issue exists, the concerns documented, a commitment to address them or explain why not. Validation is not agreement. It is recognition that the fear is real.
Reframe and co-create
Design sessions and pilots. When resistors become co-designers, they own the solution.
Act and close the loop
Show the specific modifications made, attribute them to whoever raised the concern, measure whether the root issue moved. This is what buys you honest resistance next time.
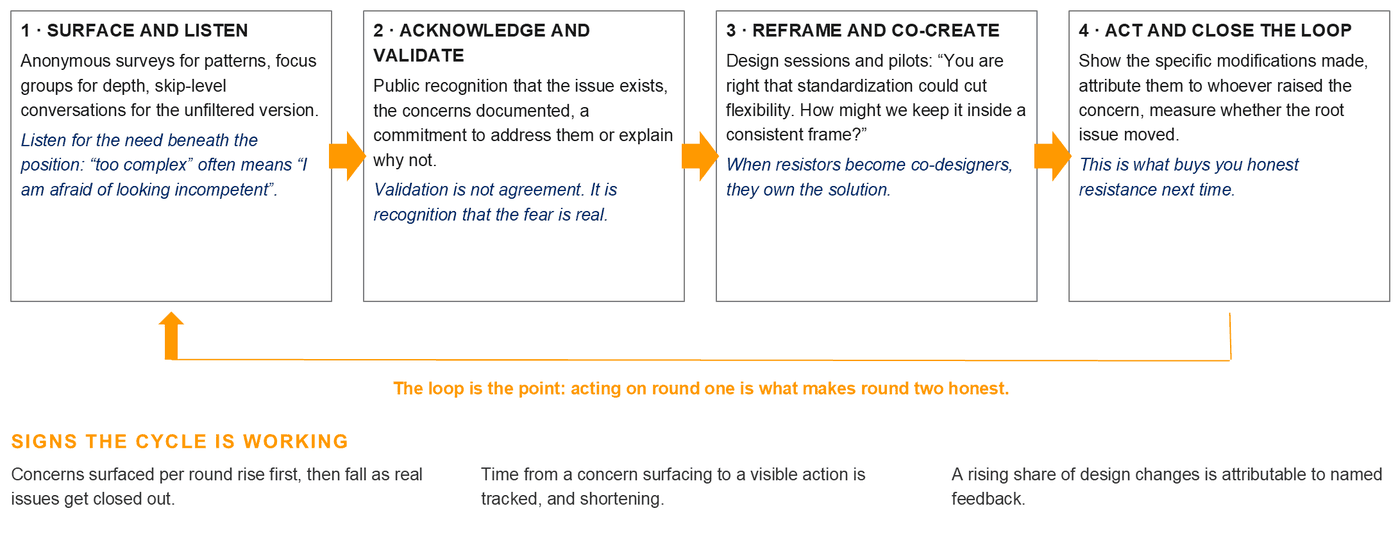
Signs the cycle is working: concerns surfaced per round rise first, then fall as real issues get closed out. Time from a concern surfacing to a visible action is tracked, and shortening. A rising share of design changes is attributable to named feedback.
The change is being led, not announced.
Entry criteria
A change narrative that names what is ending, not only what is beginning. Sponsor and coalition identified by name rather than by role. Stakeholder map covering every group the model touches.
Exit criteria
Narrative tested with a group that had every reason to reject it. Mobilization plan owned by line leaders rather than the programme. Communication running on a cadence, with a channel that carries answers back. Resistance logged as intelligence, with a named response to each recurring objection.
Deliverables
Change narrative canvas. Stakeholder and coalition map. Communication plan with cadence and owners. Resistance log with responses. Leadership commitment record.
Reflection questions
Answer these before the first communication goes out. A narrative that only describes the future asks people to grieve in private.
- What is ending for each group, and who has said so out loud?
- Which line leaders would carry this narrative without the programme in the room?
- Where does your communication carry answers back, rather than only pushing messages out?
- Which recurring objection is actually a design flaw you have not yet fixed?
- What would you stop doing to free the leadership attention this needs?
Master deliverable checklist.
What each stage owes, and who is accountable for producing it. A gate reviews this list rather than a status report.
| Stage | Deliverables | Accountable |
|---|---|---|
| E · North star | North star statement; five completed canvases; embedding plan for five systems. | Executive sponsor |
| V · Baseline | Capability heat map; maturity matrices; coverage matrix; decision inventory; governance map; debt register. | Transformation director |
| O · Principles | Design principles with per-function implications; tension mapping canvas; stress-test record. | Executive sponsor |
| O · Conceptual | Six architecture choices with rationale; philosophy analysis tools; cross-dimension dependency map. | Integration lead |
| L · Logical | Six logical blueprints; pattern menu; interface contract register; confidence map. | Workstream leads |
| L · Detailed | Specifications per dimension; readiness checklist with evidence; design decision log. | Workstream leads |
| V · Execution | Integrated roadmap; prioritized portfolio; plateau definitions; benefits realization matrix; scorecard pack. | TMO |
| E · Evolution | AVAL dashboard; adoption maps; evolution backlog; learning library; council charter. | Operating model council |
Metrics and KPI library.
Six families. Pick from them rather than inventing measures, so a number means the same thing in two different workstreams.
Design quality
Capabilities with a single primary owner. Decisions traceable to a design principle. Interface contracts documented. Scenario tests passed without cross-dimension conflict.
Execution
Milestones on time. Budget variance. Resource utilization against plan. Issue age and backlog. Scope changes approved and rejected. Defect and rework rates.
Value
Cost per transaction. Revenue per customer. Margin by product. Cycle time. Error rate. Automation percentage. Net promoter and customer effort. Value realization index.
Adoption
Adoption depth score and its three components. Training completion and competency. System usage and process adherence. Champion activation. Resistance and escalation volume.
Health
Critical incident rate. Service level attainment. Exception rate. Technical debt trend. Overtime, turnover and engagement. Knowledge transfer completeness. Benefits erosion.
Evolution
Adaptation velocity by change type. Learning application rate. Evolution pressure score. Evolution backlog age. Capability maturity progression.
Pitfall catalogue.
One characteristic failure per stage, each with the signal that says it is already happening.
| Stage | Pitfall | Signal it is happening |
|---|---|---|
| E · North star | Purpose restated from the existing mission statement rather than reconstructed from evidence. | Every box fills with corporate language. |
| V · Baseline | Documentation accepted as a description of how the work is actually done. | Nobody can name a person who follows it. |
| O · Principles | Principles written as preferences, with no price attached to any of them. | Nobody in the room would fight about one. |
| O · Conceptual | A fantasy architecture that claims the benefits of every archetype and the costs of none. | Decentralized like Spotify, coordinated like Apple. |
| L · Logical | Blueprints drawn dimension by dimension, with no interface contracts between them. | Two blueprints assume different owners for the same data. |
| L · Detailed | Paralysis by detail, or specification so thin the build team fills the gaps by guessing. | Design review opens questions faster than it closes them. |
| V · Execution | One go-live carrying all of the benefit, with governance that waves gates through. | No plateau has an exit criterion anyone has tested. |
| E · Evolution | The council dissolves with the programme, and the model starts aging on day one. | The first change after go-live arrives as a new business case. |
Adaptive capability traits.
Five traits, each scored on five indicators from 1 to 5 against observable evidence. Sensing and decision-making are weighted more heavily.
Sensing mechanism
How the organization detects change in its environment before that change becomes an incident.
Decision architecture
Whether a detected signal reaches someone with the authority to act on it, and how quickly.
Modular design
Whether components can change independently, or whether every change renegotiates the system.
Learning integration
Whether lessons reach the forum where the comparable decision is taken.
Resilience mindset
Whether change is met as disruption to absorb or as normal operating conditions.
| Score | Level | What it means |
|---|---|---|
| 1 | Rigid | Change resisted as unwanted disruption. |
| 2 | Reactive | Responds only once impact is unavoidable. |
| 3 | Responsive | Detects and responds quickly, without anticipation. |
| 4 | Adaptive | Anticipates and adjusts before impact. |
| 5 | Evolutionary | Shapes change in its market as standard practice. |
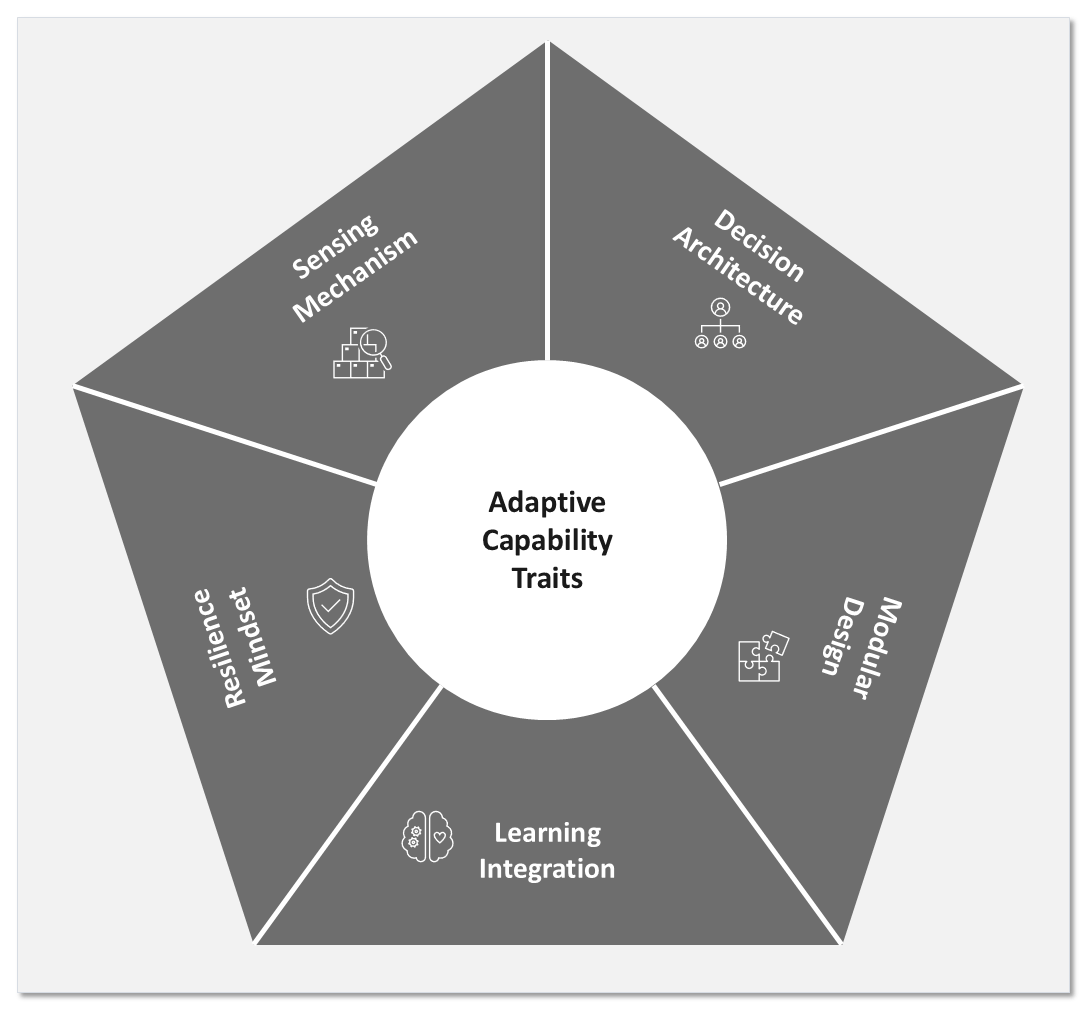
Baseline before transformation, then reassess quarterly with the leadership team plus a sample of 50 or more employees. Expect movement over years rather than quarters, even with focused investment.
Glossary.
The terms this method uses in a specific sense, defined once so a phrase means the same thing in a workshop and in a steering pack.
Accountability
Every critical element has one designated owner with authority to decide and responsibility to deliver.
Active value management
The continuous cycle that converts promised benefits into actual value: track, diagnose, correct, scale.
Adaptation velocity
Elapsed days from recognizing a change need to that change being operational and delivering value.
Adoption depth score
A 0 to 100 measure of real behavioural change rather than surface compliance.
Aspiration
The desired future state within strategic intent, stated with numbers and dates.
Baseline
The documented current state of capability, performance and maturity against which all progress is measured.
Benefits ownership matrix
Assigns each benefit to a single executive owner with authority and accountability for delivery.
Business capability
What an organization does to create value, independent of how it is done or who does it.
Capability maturity
How well a capability is performed, scored on five levels from initial to optimizing.
Conceptual layer
The organizing philosophy for each of the six dimensions. Answers WHAT.
Core beliefs
How the organization behaves when doing so costs money. Principles with price tags.
Coverage matrix
Capabilities against departments, marking primary, supporting and contributing ownership.
Design principle
A rule that resolves a recurring tension, enabling consistent decisions without escalation.
Detailed design layer
Role, process, configuration, template and policy specifications. Answers WHO, WHERE, WHEN.
Evolution debt
The accumulated cost of workarounds chosen over real solutions, compounding while unpaid.
Four lenses method
Diagnosis through capability, maturity, structure and governance, then cross-validation.
Learning application rate
The share of relevant captured lessons that actually influence later decisions.
Logical blueprint layer
How capabilities connect, information flows and decisions are made. Answers HOW.
Modular specificity
Specifying interfaces tightly and internals loosely, so modules can change without renegotiating the system.
North star
The enduring WHY: purpose, aspiration, core beliefs and identity as one reinforcing system.
Operating model
How an organization is arranged across six dimensions to deliver its strategy.
Operating model council
The permanent body that stewards operating model health and evolution after the programme closes.
Operating rhythm
The fixed cadence of stand-ups, integration meetings, steering committees and board reviews.
Plateau
A stable intermediate operating state that delivers value and could be held indefinitely.
RACI matrix
Responsible, accountable, consulted, informed; extended here with verifies and signs off.
Rapid response protocol
The standing team and pre-agreed authority triggered when evolution pressure exceeds 80.
Resource heat map
Resource demand against capacity by function, capability and time period.
Six dimensions
Enterprise, workforce, value, digital, management and governance, examined at every design layer.
Stage gate
A decision point with entry criteria, exit criteria and named deliverables that must be evidenced.
Strategic intent
The integrated statement of purpose, aspiration, beliefs and identity that anchors design.
Transformation management office
The engine that drives execution and coordination, rather than tracking it.
Transformation scorecard
The four-perspective view of execution, value, adoption and health.
Value-complexity canvas
Prioritization of initiatives into quick wins, strategic investments, fill-ins and questionables.
Value leakage
Benefits lost after successful implementation through exceptions, added steps and shadow systems.
Value realization index
Benefit delivery against business case, weighted for early delivery and delay.
Value stream
The end-to-end flow of activity that creates and delivers value to a customer.
Four forces pressuring the model.
Four external forces converge on the operating model at once. They cannot be answered one at a time, and none of them is a tweak around the edges. This is why the sixth stage exists: the model has to absorb pressure it has not yet met.
AI and automation
Redraw the human-machine capability boundary continuously. Design for collaboration, not another tool.
Ecosystem models
Value is created across partners. Interfaces and decision rights must work beyond the org chart.
Talent and workplace
Skills, location and employment models shift faster than structures. Role architecture must flex.
Sustainability
Non-financial outcomes become operational obligations, audited like any other measure.
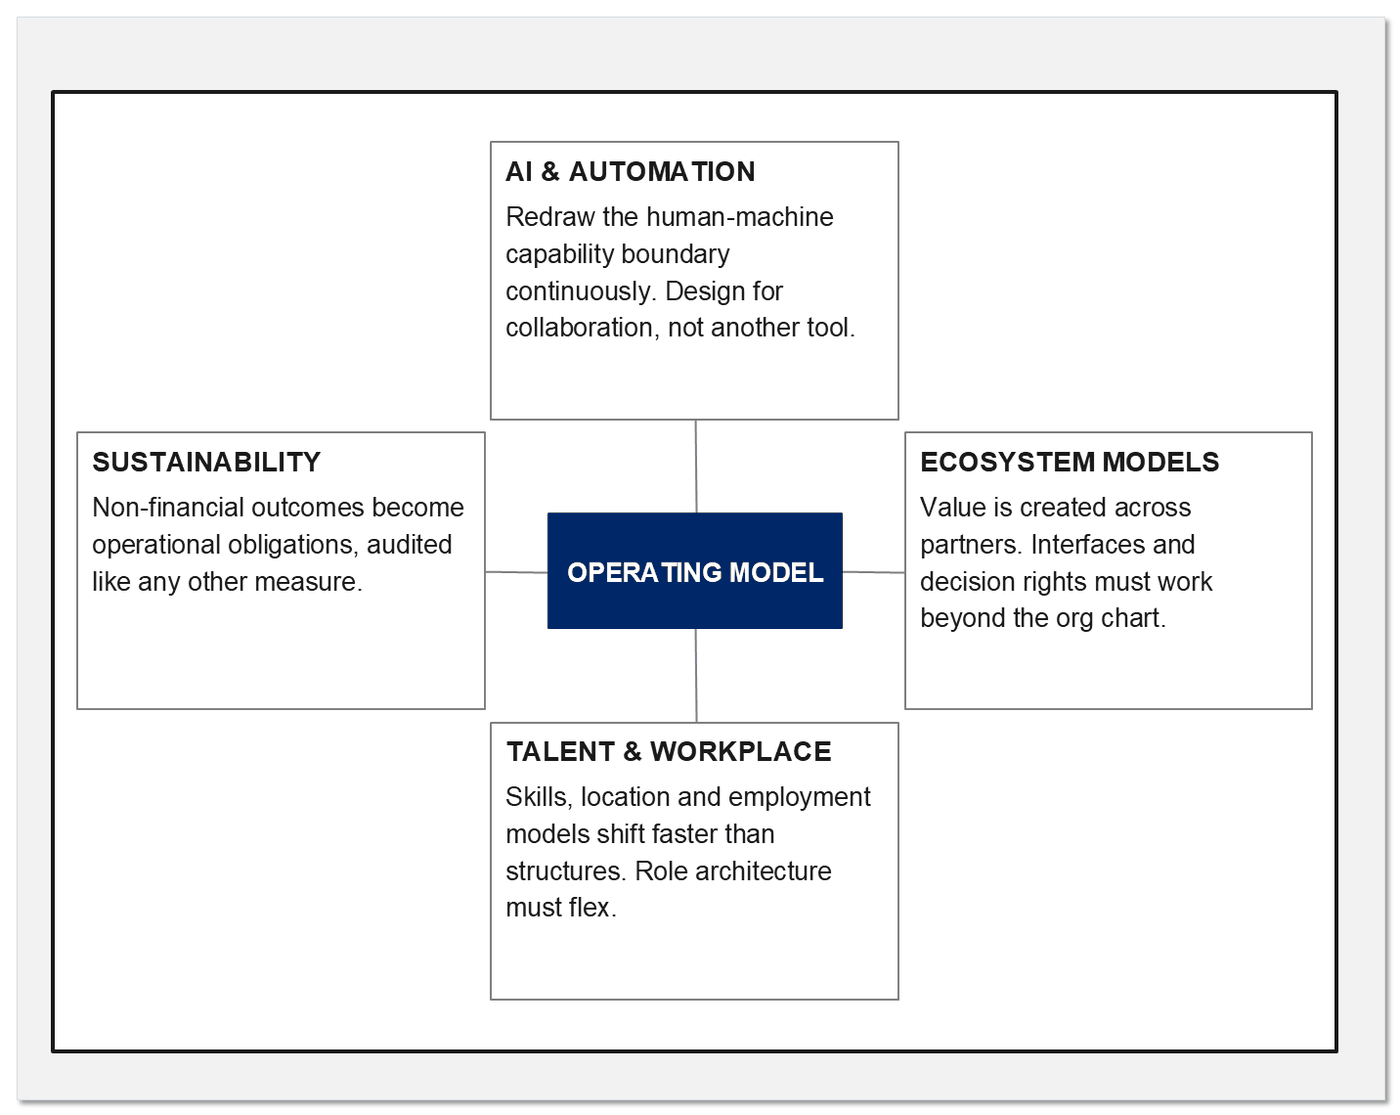
From architect to gardener
The architect designs a structure and hands it over. The gardener tends conditions, prunes what is not working, and keeps the system alive as the season changes. The operating model is the second kind of work.
Start with three decisions in the next 30 days that the north star will settle, and one workaround from the evolution debt register that you will repay properly.
One outcome: an operating model that delivers the strategy today and can be changed again next year without starting over.
Reference framework v1.0, adapted from the EVOLVE practitioner field guide. Use it, adapt it, or talk to us about running it in your organization.